 Grape growers are encouraged to use a combination of soil, plant, and weather data when determining the length and frequency of irrigation events in vineyards. The most common questions growers want to answer with regard to vineyard irrigation are:
- How often should the vineyard be watered?
- How much water should be applied per irrigation?
Estimation of daily evapotranspiration can tell a grower roughly how much water is removed from the soil, and is the principle means by which growers can determine the amount of water to apply to a vineyard block. Plant data (such as leaf or stem water potential determined by means of a pressure chamber) is often used to determine how vines are responding to the amount and frequency of water applied. For example, if a grower wishes to strategically apply less water than the amount lost to evapotranspiration (a deficit irrigation strategy) a plant water status measurement can be used to indicate the degree of water stress the vines are experiencing.
 Why measure soil moisture?
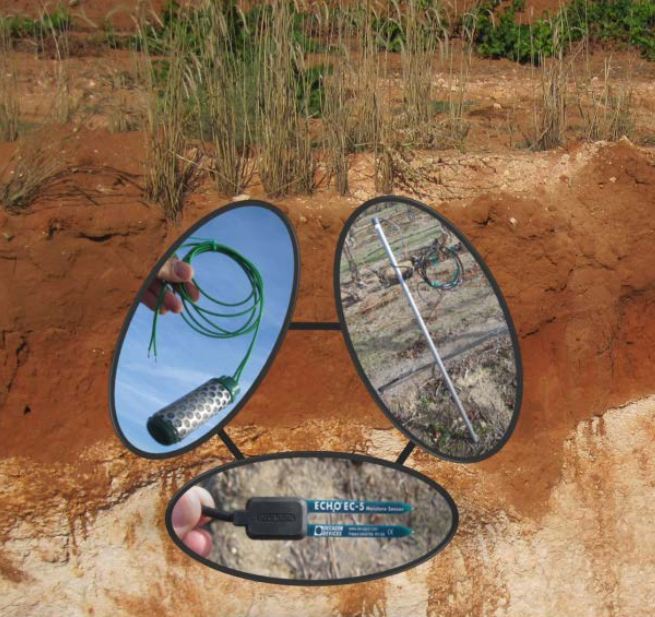
Soil moisture sensors are a useful tool for assisting with vineyard irrigation scheduling. For example, water status of the soil can be measured during the dormant season to determine if winter rainfall is reaching the effective rooting area of vines. Soil moisture sensors are also helpful for determining the length of irrigation time required to replenish water to a desired rooting depth. The data provided by soil sensors can help growers to understand how water moves in soil and the areas where roots are most actively taking up water, potentially reducing excess water application. In areas where water quality is affected by high salts, soil moisture sensors can provide valuable feedback regarding the effectiveness of irrigation or rainfall with regard to potential leaching of salts outside of the root zone. Proper placement of soil sensors is critical for obtaining data that will be useful to improve vineyard irrigation scheduling.
______________________________________________________________________________________
This Coffee Shop article originally published by the the Vineyard Team, a nonprofit organization dedicated to promoting sustainable winegrowing since 1994. More information about the Vineyard Team can be accessed from their website: www.vineyardteam.org. This is the first of a two part series on using soil moisture sensors irrigation management in vineyards. Here, in Part I, we will focus on selecting locations to install soil moisture sensors. Next week, in Part II, we will take a look at depth of soil Sensor placement and proximity to drip emitters and vines. In Part III, we will cover common types of soil moisture sensors and tips for installation. The original document can be accessed by clicking HERE. 2014 All Rights Reserved.
______________________________________________________________________________________
Key Concepts
- Soil sensors must be installed in the location that best represents a vineyard irrigation block.
- Mapping soil (pre and post planting) and vine vigor patterns (post planting) provides useful information for selecting sensor installation sites.
- A strategy must be developed to evaluate the soil in a block to verify placement of sensors in a representative soil profile.
Selecting a representative location
Ideally, a grower would install soil moisture sensors in multiple locations per irrigation block to obtain an average of soil moisture across a site. However, the cost of sensors and the associated telemetry devices required to retrieve data from a large number of data logging stations is often a limiting factor when choosing the number of sensors to install. For this reason, it is most common for growers to install moisture sensors in only one or two sites within an irrigation block. When implementing a small number of data points across a vineyard, it is important to choose a soil profile that best represents the majority of the irrigation block.
For example, installing soil moisture sensors in an area of shallow soil or with less water holding capacity than is typical of the whole block can potentially result in sensor readings that overestimate the frequency of irrigation sets needed within that block. Conversely, the installation of sensors in an area having deeper, heavier clay soil than is typical of the block will result in sensor readings that potentially underestimate the water needs of the whole block (Figure 1).
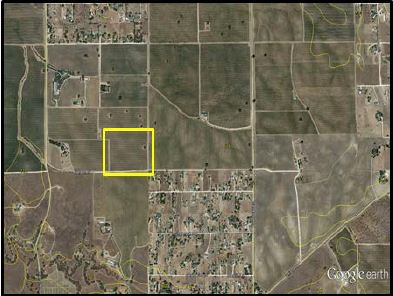
Figure 1: Fine yellow lines outline soil series as identified by the National Resource Conservation Service, Web Soil Survey, and the block of interest is outlined in the yellow box.
Mapping vineyard soils
Ideally, a vineyard soil will be fully mapped prior to designing a vineyard and establishing irrigation blocks to be irrigated differently as needed. Soil maps are available online from the United States Department of Agriculture, National Resource Conservation Service (USDA-NRCS) – Web Soil Survey (Figure 1).
These maps show the approximate boundaries of distinct soil series and can serve as a good starting point for determining where a soil may change within a site.
Maps from the USDA-NRCS are helpful to describe the soil type of an area, however they not accurate enough to be used alone for selecting where to install soil moisture sensors. On-site mapping of vineyard soils by a soil scientist or vineyard soil expert is recommended to understand the precise boundaries of different soil types. Soil characteristics that may change across a soil series include effective rooting depth, depth to bedrock or hardpan, soil texture, and depth of distinct soil horizons. The process of mapping a soil involves excavation of multiple soil observation pits across a site in order to establish where changes in soil characteristics occur. The potential influence of different soils on plant growth is then estimated based on the knowledge and prior experience of the soils expert. Before a vineyard is planted, soil pits can be excavated using a backhoe. Additionally, hand operated soil augers can be used to capture disturbed soil profile samples and assist in delineating changes in soil across a block. Hand or electric powered augers will disrupt less soil volume on a site. In established vineyards, large excavation equipment can be more difficult to maneuver, making use of portable hand or mechanical augers more accessible.
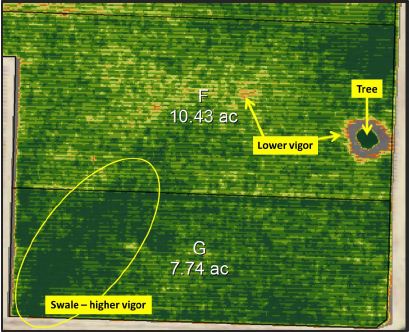
Figure 2: Normalized Difference Vegetative Index (NDVI) map of an existing vineyard shows areas of high vigor in dark green and those of progressively lower vigor in yellow, orange and red. A combination of deeper clay soil and the drainage pathway provided by highlighted swale are the likely reasons for higher vigor. Soil sensors should not be placed in these areas if the data is to be representative of the majority of the block.
Mapping vineyard vigor
Differences in soil across a vineyard block often contribute to growth differences in vines as observed in the canopy. Vegetation index maps, often referred to as “vigor maps,” are helpful tools for understanding differences in relative vigor across a mature vineyard block. Differences in vigor may be due to numerous factors, including changes in soil characteristics.
Normalized Difference Vegetation Index (NDVI) mapping is one of the most commonly used tools for tracking differences in vegetative growth across a vineyard (Figure 2). NDVI images provide a snapshot in time (e.g., mid-summer) when the relative canopy size and health can be compared within a vineyard block. Vines or areas of low NDVI will use less water, drying the soil at a slower rate than vines or areas with a higher NDVI. Additional, low tech measures can be taken to verify growth differences observed from NDVI maps, including dormant pruning weights of vines and visual observation.
Pre-plant considerations
Uniform vine growth is desired within a vineyard block. Variability of soil across a vineyard site should be considered when designing the layout of vineyard blocks and irrigation. In general, larger vineyard blocks are more economical to establish and manage, therefore it is not always practical to divide blocks by soil type. However, irrigation design in the pre-plant phase allows a grower to customize a system across a block, such as developing separate irrigation zones to address differences in soil water holding capacity. It is also useful to have historical photos or satellite images and crop use information to identify areas of the site that may have had large areas of soil disturbed (e.g. uprooted trees, trenching for pipelines, compacted roadways).
Choosing sensor locations in an existing vineyard
The goal when choosing sensor locations in an existing vineyard block is to locate an area of the vineyard with soil that best represents the majority of the irrigation block. Placement of sensors in the outlying soils of lowest or highest water holding capacity can result in soil moisture readings that lead to either excess or under-irrigation. Supplemental irrigation may be needed in the weakest area of the vineyard block.
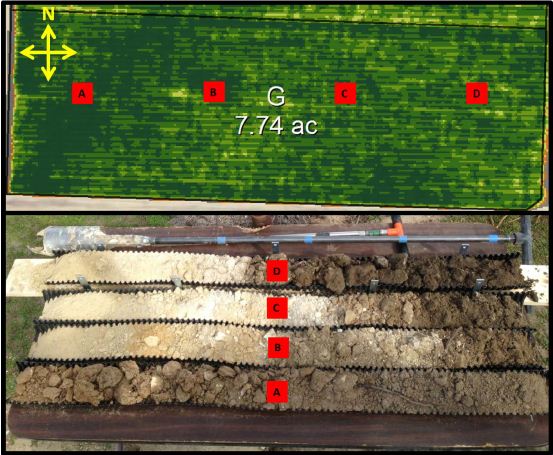
Figure 3: A 7.74 acre block of Cabernet Sauvignon is planned as a single unit for irrigation. Soil cores extracted to a depth of 4 feet from west to east (A,B,C,D) reveal differences in depth of soil horizons across the block.
In Figure 3 we see a photo of four disturbed soil cores taken with a four-inch hand auger in the 8 acre Cabernet Sauvignon block of interest. The soil core from the higher elevation (D) comes from the east side of the block. The two soil cores in the middle (B,C) are from the center of the block just east of the swale. The soil core from the lowest elevation (A) is from the center of the high vigor swale area on the west side of the block. Note that the soil from the high vigor area (A) of the vineyard has clay content as deep as four feet, whereas the soil core from the top of the hill (D) has heavy clay top soil down to about two feet, followed by a sharp transition to loam. The two cores from the center of the block (B,C) are of the most representative soil, having a sandy clay loam top soil, transitioning to clay loam, then loam subsoil.

Figure 4: A grid pattern is devised for evaluation of soil cores on the area of the block that represents the most common vigor patterns from NDVI mapping (A,B,C,D,E,F).
After reviewing soil maps and vine vigor, a strategy can be developed to evaluate soil in the irrigation block. The map in Figure 4 illustrates a grid of points where disturbed cores were taken to evaluate soil horizon depth. The location for soil sensor placement was selected in an area that represents the most commonly observed soil profile across all sample sites (Figure 5).
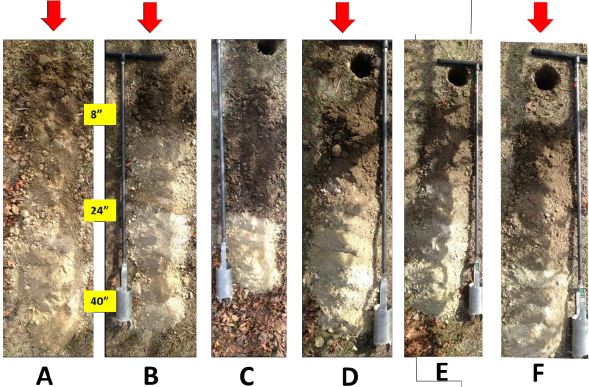
Figure 5: Disturbed soil cores excavated with a hand auger are laid out on the vineyard floor for visual evaluation. The red arrows indicate profiles that are visually more representative of the block.
Materials are based upon work supported by industry contributors and the Natural Resources Conservation Service, U.S. Department of Agriculture, under number 68-9104-3-177. Any opinions, findings, conclusions, or recommendations expressed in this publication are those of the authors and do not necessarily reflect the views of the U.S. Department of Agriculture.
______________________________________________________________________________________
