MARCH 30, 2020. BY STAN GRANT, VITICULTURIST.
Remote sensing is the process of acquiring information about something without contacting it. In agriculture, remote sensing usually refers to passive sensing in the air of reflected radiation from the earth’s surface, especially radiation reflected from plant canopies. Aerial images are depictions of sensor data after computer processing. Individual ground features reflect radiation differently, which is apparent in aerial images as different colors or different color intensities. Changes in canopy characteristics over time are also apparent as color changes in sequential images.
The Promise of Aerial Images for Vineyard Management
Aerial images have the potential to greatly enhance our vineyard monitoring efficiency because they allow us to see more vines at once and conceivably, more vines on a regular basis. They also permit us to identify vineyard problems early in their development and track the progress of measures taken to correct them. Further, they show the progress of certain vineyard operations, such as mowing, disking, hedging, and harvesting. Lastly, aerial images may reduce our vineyard monitoring costs by replacing vineyard transects with strategic spot checks.
Aerial images may also increase our vineyard management effectiveness. Often, the quality of a decision depends on the amount of available information. For this reason, aerial images, which provide information in abundance, can help us make better vineyard management decisions. They also facilitate communication with our support staff and service providers about specific locations and the extent of areas of concern. Finally, they help us focus our efforts and resources on problem areas, while avoiding needless efforts elsewhere.
So, if aerial images are useful, why aren’t more vineyard managers using them? After all, they have been commercially available for over 30 years. I believe 4 factors have limited adoption of remote sensing technology in vineyard management. They are spatial resolution (area per datum), quality (distortion corrections), timeliness (fly over frequency), and cost. Those limitations appear to behind us with the arrival of a new generation of aerial imagery products (Figure 1). Most of these products also offer smart phone and tablet apps with features that enhance the utility and value of aerial imagery for in-field use.
Figure 1. Some aerial imagery suppliers in California and their contact information.
In this article, I provide a few examples of how aerial images can be used to advantage in vineyard management, but first we will delve into the primary image among those commonly available, the NDVI.
About NDVI images
The normalized difference vegetative index (NDVI) is a calculated canopy reflectance parameter. It contrasts strong infrared reflectance against weak red reflectance from foliage. In so doing, the NDVI both amplifies light reflectance and normalizes reflectance values for easy comparisons over time and among vineyards. Depending on the supplier, NDVI images may go by different names, such as “Vigor Maps” or “Enhanced Vegetative Index (EVI)”.
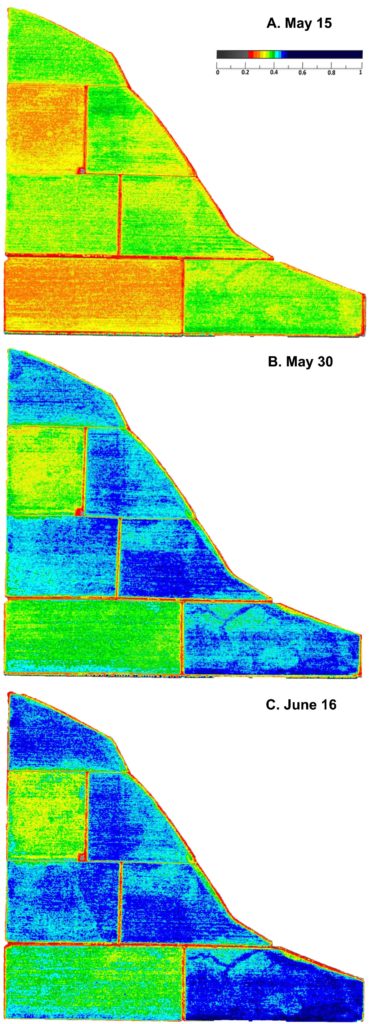
Figure 2. Early season vigor maps (NDVI) for 5 Chardonnay and 2 Pinot gris vineyards with the same row orientation, row spacing, and Wye trellis.
NDVI values relate to canopy size, density, and health, and they imply photosynthetic capacity and other plant factors. Absolute NDVI values range between 0 and 1, while NDVI values for grapevine foliage typically range between about 0.20 and 0.53. Some aerial image suppliers provide numerous NDVI scales, some of which focus on and provide greater resolution within the NDVI range of grapevine canopies.
Sometimes, NDVI images contain so much data that they are difficult to interpret. To address these instances, some aerial images suppliers combine categories of NDVI values into fewer groups to produce simplified NDVI zones. Such zoning maps are useful for designating management zones within vineyards and allocating inputs. Below we put the NDVI to work.
Monitoring Canopy Changes
An important early season viticultural objective is the growing of complete canopies by around fruit set. To do so, shoots must grow at least at a moderate rate. If their growth is slower, vineyard managers need to take timely actions before the fruit sets to increase vine resources directed towards shoots. Later attempts to stimulate shoot growth, after the vine is directing resources into berries, require extreme measures that are less efficient than earlier efforts and contrary to the production of optimum quality wine grapes. Of course, before actions can be taken a need must be recognized. In this regard, NDVI images are helpful.
The series of NDVI images in Figure 2 show early season canopy changes in a vineyard composed of seven blocks. All blocks share the same Wye trellis, east-west row orientation, and row spacing. Five were fully developed Chardonnay blocks. In these blocks, canopy development was well timed as depicted in the transition from yellow and green to turquoise and blue across the three images.
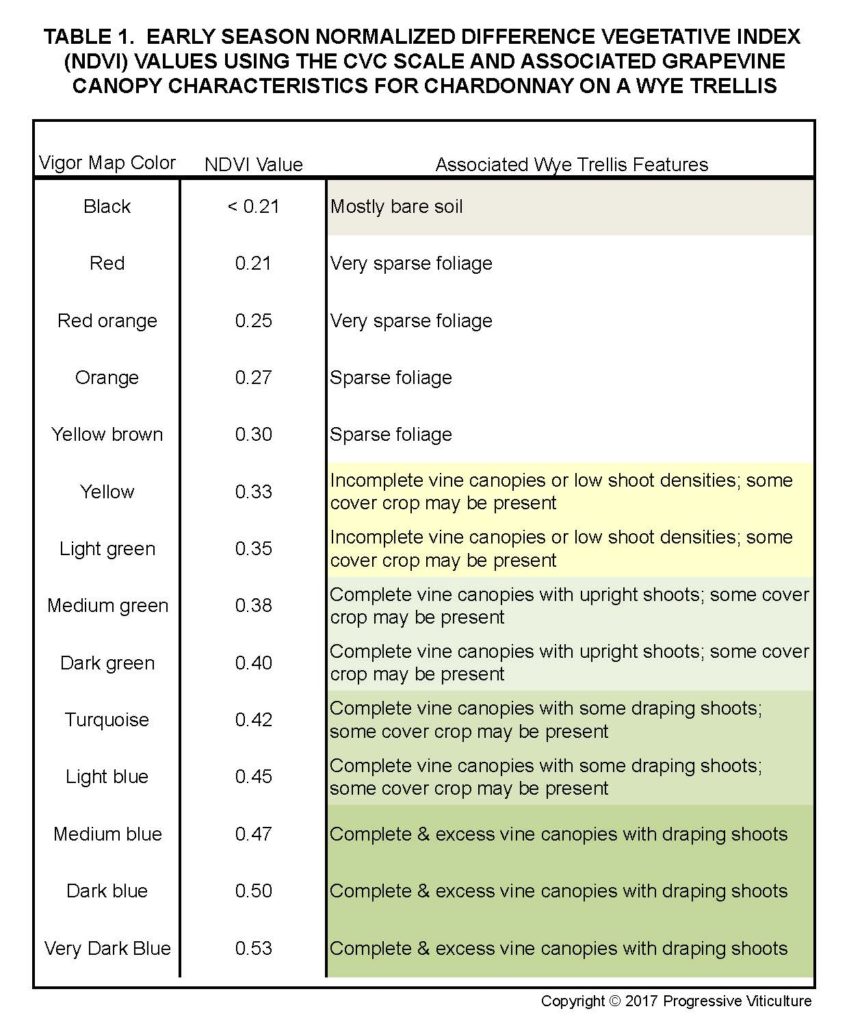
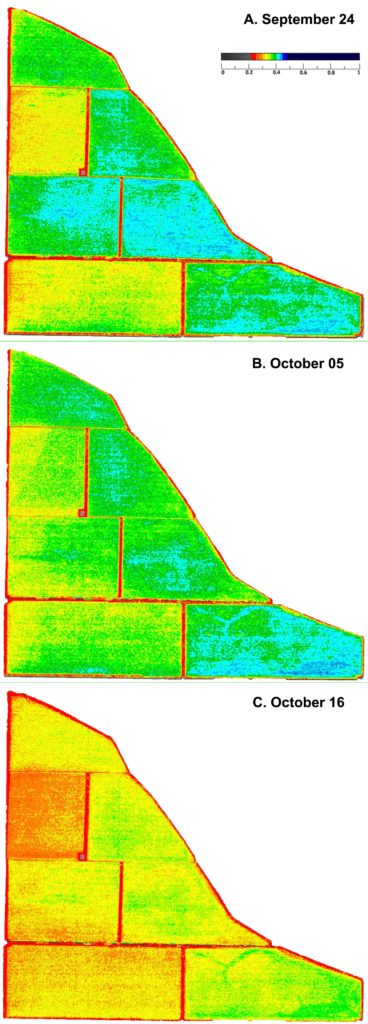
Figure 3. Late season vigor maps (NDVI) for 5 Chardonnay and 2 Pinot gris vineyards with the same row orientation, row spacing, and Wye trellis.
Two of the blocks in Figure 2 were Pinot gris blocks about to bear their first crop. Their early season canopy development lagged behind that of the Chardonnay. In fact, the orange in the first image (Figure 2A) indicated sparse foliage in the Pinot gris while at the same time, many vines in the Chardonnay blocks had complete canopies with upright shoots, which was evident as medium green (Table 1). Based on these image data, the vineyard manager took prompt action, which resulted in most Pinot gris vines developing complete canopies and carrying moderate crops.
Late season changes in canopies are also apparent in NDVI images, but the sequence of color changes is essentially reverse of those early in the growing season (Figure 3). During this time, the changes represent leaf tissue deterioration due to age, which is associated with declining leaf function rather than loss of leaf area. Grapevine canopies on October 16 (Figure 3C) appeared similar to the incomplete canopies present before May 15 and their photosynthetic activity was similarly limited. The value of applied water and fertilizer were correspondingly limited at this time.
How Much Canopy Variation is Too Much?
Variability in grapevine growth, canopy development, and fruit production within vineyard blocks is a fact of viticultural life. Likely causes of such variability include, but are not limited to variations in soil depth, texture, rockiness, and drainage, as well as slope and aspect. An important question for vineyard managers is: how much variability is acceptable and how much is too much?
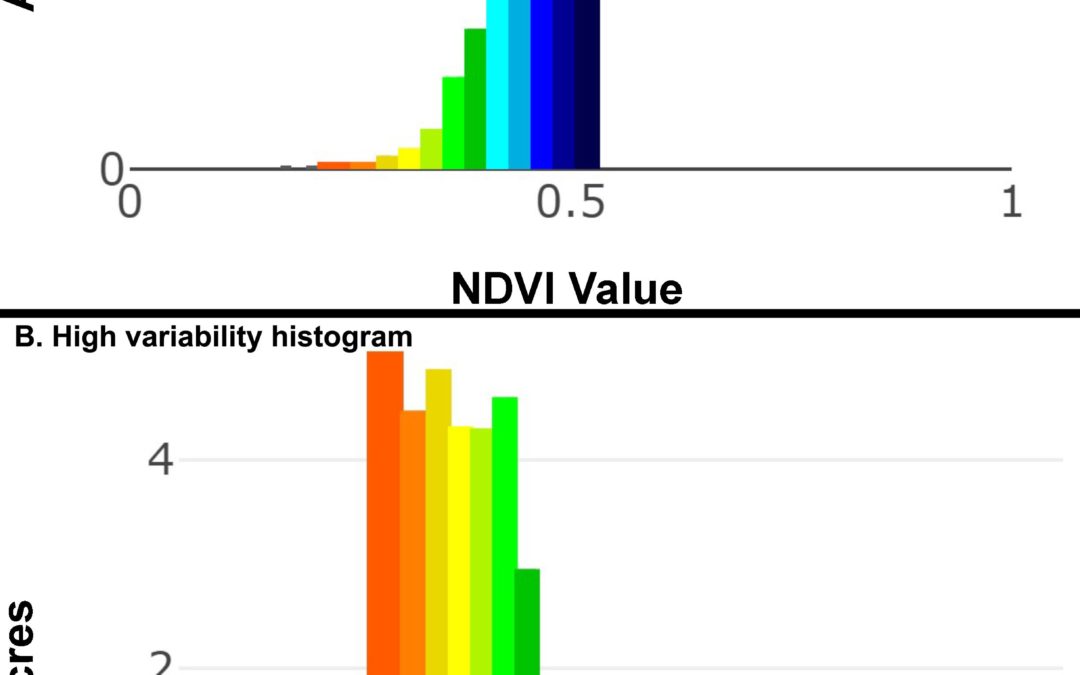
Some aerial image suppliers provide supplemental information to help answer this question, usually as histograms. Histograms are charts that use bars to show how many times a NDVI class occurs within an image. Quite simply, the fewer the color classes and the more closely they are grouped together in a histogram, the lower the canopy variability within the vineyard block.
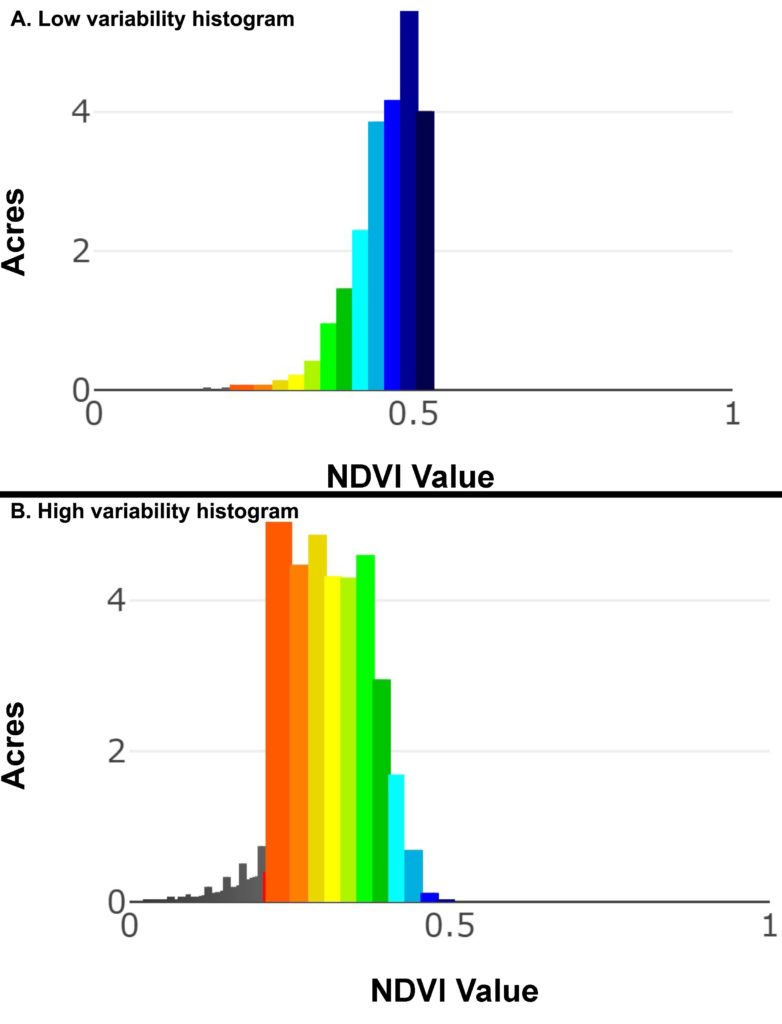
Figure 4. Mid season histograms (frequency charts) of normalized difference vegetative index (NDVI) classes for a Chardonnay vineyard on Wye trellis (A) and a head trained Zinfandel vineyard (B) on the same date.
In Figure 4, the upper histogram represent NDVI classes in a Chardonnay vineyard with a Wye trellis on August 28, 2017. It indicates both low variability and mostly complete canopies with draping shoots (NDVI ≈ 0.45 to 0.53 or turquoise to dark blue). The lower histogram is for a goblet-formed head trained Zinfandel vineyard on the same date (Figure 4B). In it, a wide range in canopy development is apparent in the wide range of NDVI classes. Further, the shorter blue bars suggest few vines had draping shoots, while the longer red bars suggest large areas of very sparse foliage.
Even the most uniform vineyard at full canopy will display canopy variation early in the growing season while shoots are growing and late in the season while leaves are senescing. This is illustrated in Figure 5. This figure shows NDVI variability over the course of the 2016 growing season for 5 fairly uniform Chardonnay vineyards with the same vineyard design. In it, variability is shown as percentages of average NDVI values (coefficients of variation). In addition to showing higher variability early and late in the growing season, Figure 5 suggests normal mid season variability of Chardonnay on a Wye trellis is about 18% to 20%. Values greater than these represent too much variability.
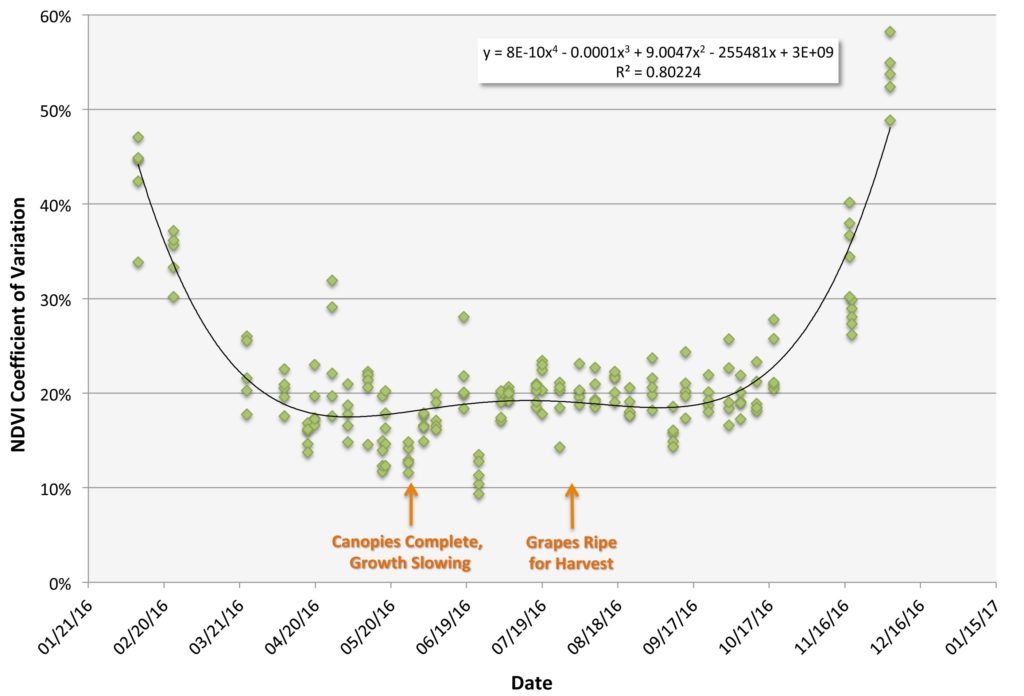
Figure 5. Normalized NDVI variability (coefficient of variation) for 5 Chardonnay vineyards with the same row spacing and on the same Wye Trellis during the 2016 growing season. (Progressive Viticulture©)
Thermal images
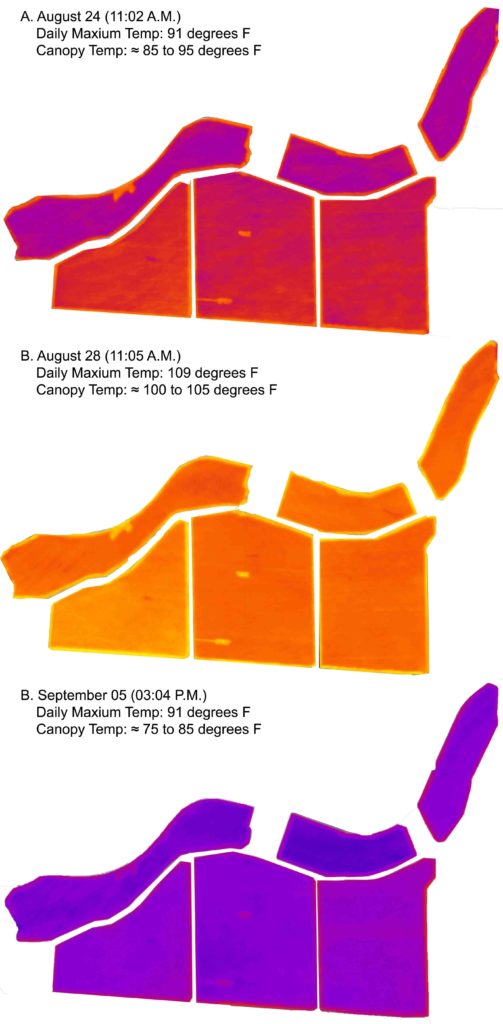
Figure 6. Thermal images immediately before, during, and immediately after a period of high daily maximum temperatures for 5 Chardonnay blocks with the same row spacing and on the same Wye trellis.
The thermal image represents reflected far infrared radiation, which correlates with canopy temperatures. Canopies, of course, cool as vines lose water to the atmosphere through transpiration. As a result, where vines have access to ample soil water, canopies appear cooler than they do where soil water is in short supply.
During 2017, much of California experienced an extended period of high daily maximum temperatures during late August and early September. Grapevine canopy temperatures were affected accordingly. The series of images in Figure 6 display these effects in 6 Chardonnay blocks, all of which share the same Wye trellis and row spacing. They were also similarly irrigated, receiving 65% to 70% of grape ET during this period of time.
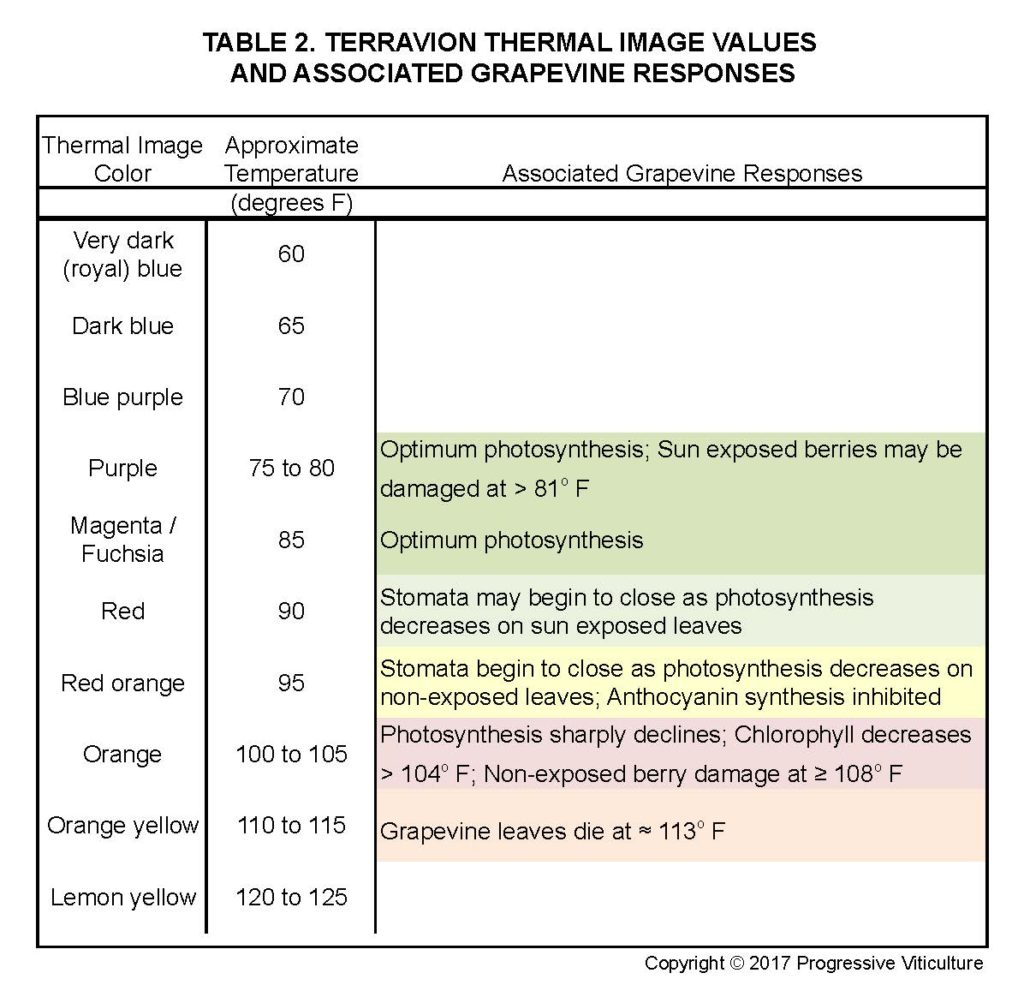
On the day before the onset of triple digit maximum air temperatures, canopy temperatures were mostly between 85o F to 95o F (Figure 6A). Photosynthesis in the warmest leaves in this range was somewhat inhibited (Table 2). In the middle of the heat spell, canopy temperatures rose to 100o F to 105o F and photosynthesis sharply declined, as did sugar accumulation in berries (Figure 6B). During the same time, exposed berries and portions of exposed leaves were likely damaged. The day after the intense heat subsided, canopy temperatures plummeted to 75o F to 80o F (Figure 6C). At these temperatures, after they recovered, intact leaf tissues resumed optimum photosynthesis. Leaf recovery, however, drew vine resources away from ripening, which was delayed.
Other Aerial Images
In addition to NDVI and thermal images, many aerial image suppliers provide infrared images and enhanced color images. Color aerial images show reflection of visible radiation composed of blue, red, and green light. Grapevine foliage adsorbs large amounts of blue and red light due to the chlorophyll it contains. The absorption of red is particularly important because it is photosynthetically active. Due to weaker absorption, more green is reflected than blue and red, which makes foliage appear green to us in the field and in color images. Because foliage chlorophyll content varies with foliage age and condition, so does its color reflective signature and appearance in the images. Consequently, the more vigorous growing and healthy the foliage, the greener it appears.
Infrared aerial images shows reflected light in the near infrared range. These wavelengths of electromagnetic radiation, which are longer than visible wavelengths, are beyond our ability to see. For remote sensing, near infrared offers two advantages over visible radiation. First, it readily penetrates the earth’s atmosphere, even on hazy or cloudy days. Second, plant tissues more strongly reflect near infrared than visible light. Due to this combination of factors, near infrared radiation more consistently and more intensely portrays foliage condition. More infrared radiation is reflected where more foliage is present and/or where it is denser. Stressed foliage reflects less infrared radiation than healthy foliage.
Conclusions
Aerial imagery products are more accurate, less expensive, and more readily available than in the past. Due to these advances and other features, they can enhance our vineyard monitoring efficiency and vineyard management effectiveness.
This a modified version of an article published in the Mid Valley Agricultural Services January, 2016 newsletter. Article was updated for this blog post on 3.30.2020.
Further Reading
Brase, RJ. Practical application of aerial imagery for vineyard management. Proc. Plant Soil Conf. Calif. Chapt. Amer. Agron. Soc. Modesto, Calif. 5-6Feb03.
Brase, T. Precision agriculture. Thompson Delmar Learning, Clifton Park, NY. 2006.
Gregory, J. R. Using aerial images to make precision application of soil amendments. Proc. Plant Soil Conf. Calif. Chapt. Amer. Agron. Soc. Modesto, Calif. 5-6Feb03.
Keller, M. The science of grapevines. Academic Press, Burlington, MA. 2010
Ojala, J. Limitations and benefits of remote sensing technology. Proc. Plant Soil Conf. Calif. Chapt. Amer. Agron. Soc. Modesto, Calif. 5-6Feb03.
Plant, RE, Munk, DS. Aerial imagery that links soil variability to poor crop performance. Proc. Plant Soil Conf. Calif. Chapt. Amer. Agron. Soc. Modesto, Calif. 5-6Feb03.
Proffitt, T; Bramley, R; Lamb, D; Winter, E. Precision viticulture: a new era in vineyard management and wine production. Winetitles, Ashford, South Australia. 2006.
Have something interesting to say? Consider writing a guest blog article!
To subscribe to the Coffee Shop Blog, send an email to stephanie@lodiwine.com with the subject “blog subscribe.”
To join the Lodi Growers email list, send an email to stephanie@lodiwine.com with the subject “grower email subscribe.”
To receive Lodi Grower news and event promotions by mail, send your contact information to stephanie@lodiwine.com or call 209.367.4727.
For more information on the wines of Lodi, visit the Lodi Winegrape Commission’s consumer website, lodiwine.com.
