 The Census of Agriculture (COA), which provides the most complete profile of the nation’s farming sector, highlights the importance of fruits and nuts, vegetables and melons, and horticultural specialty (FVH) crops in California. The farm value of U.S. FVH commodities in 2012 was $57 billion or 27% of U.S. crop sales, while California sales of FVH commodities of $26 billion were 87% of California crop sales. The importance of FVH commodities in California
has implications for farm labor.
U.S. and California FVH Agriculture
California has a unique agricultural sector that has led the nation in farm sales since 1950 because of the importance of high-value FVH commodities. The COA defines a farm as a place that normally sells at least $1,000 worth of farm commodities a year. Most of the 2.1 million U.S. farms and the 78,000 California farms are part-time, hobby, and retirement operations that lose money farming but survive because of income from nonfarm jobs, social security, and other sources.
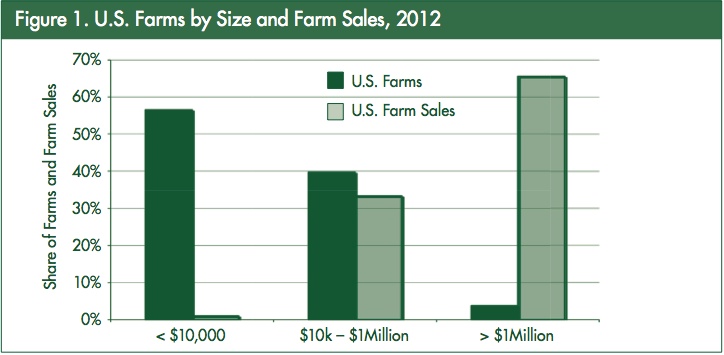
The COA reported that over half of U.S. farms, almost 1.2 million or 56%, each sold less than $10,000 worth of farm products in 2012, and they collectively accounted for $3 billion or less than 1% of the $395 billion in total farm sales (Figure 1). At the other end of the farm-size spectrum, the 81,600 U.S. farms that each had farm sales of $1 million or more in 2012, less than 4% of farms, collectively accounted for $264 billion or two-thirds of total farm sales. Most farm commodities are sold by these relatively few large farms.
FVH commodities account for a quarter of U.S. farm crop sales but over 85% of California crop sales. In 2012 California sales of fruits, nuts, and berries were $17.6 billion, vegetable and melon sales were $6.3 billion, and nursery and greenhouse sales were $2.5 billion—for a total of $26.4 billion.
__________________________________________________________________________________
California is the leading farm state because it produces almost half of U.S. fresh fruits and vegetables, many of which are labor-intensive.
__________________________________________________________________________________
FVH agriculture is similar to general agriculture in having a majority of small producers and relatively few large producers. COA Table 68, for example, notes that the 33,300 California farms classified as fruit and tree nut farms in 2012 had sales of $14.9 billion. Half of these farms, 16,000, each had fruit and tree nut sales of $50,000 or more, and these larger farms had total sales of $14.6 billion, or 98% of fruit and tree nut sales. Similarly, there were 1,200 berry farms with total berry sales of $1.9 billion, but the 530 that each sold $50,000 or more of berries accounted for 98% of berry sales.
Industry publications that report the acreage of individual growers suggest that the ten largest California producers of some FVH commodities account for 10–30% of the state’s production of a commodity. For example, Growing Produce reported that Grimmway Farms had over 50,000 acres of vegetables in 2012, 5% of the state’s vegetable cropland, and the next three largest vegetable growers each had 25,000 acres or more. Thus, the largest four growers accounted for about 15% of the state’s vegetable acreage.
Labor Expenses and Employment
The COA asks farmers to report their expenses for hired labor, including the number of workers they hire directly and the cost of wages, payroll taxes, and job-related benefits. In addition, the COA asks for the cost of workers brought to farms by farm labor contractors and other nonfarm businesses that provide workers and sometimes equipment to perform farm tasks. Some 566,000 U.S. farms reported $27 billion in hired labor expenses in 2012, making hired farm labor 8.2% of farm production expenses. Some 217,000 farms (often the same farms that had hired workers directly) reported $6.5 billion in contract labor expenses,
2% of total farm production costs.
Hired labor was a higher share of production expenses in California, where 33,950 farms reported $5.9 billion in hired labor expenses in 2012 (16.6% of farm production expenses). Some 25,100 farms reported $3.4 billion in contract labor expenses (9.5% of farm production costs), making labor over a quarter of farm production expenses. California accounted for 22% of U.S. hired labor expenses and 52% of U.S. contract labor expenses.
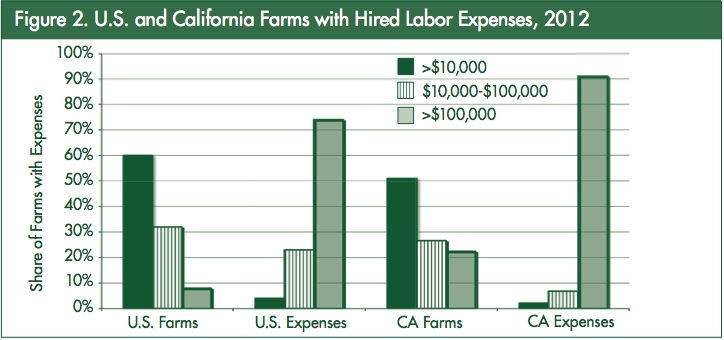
Farm production and farm labor expenses are concentrated on a relatively few large farms. The 44,200 U.S. farms that each paid $100,000 or more for hired labor accounted for 74% of direct-hire farm labor expenses, and the 15,800 that each had $50,000 or more in contract labor expenses accounted for 78% of such expenses. In California, 7,600 farms, less than 10% of the state’s farms, each paid $100,000 or more in hired labor expenses and collectively paid 92% of the total, and 6,300 each paid $50,000 or more for contract labor and collectively paid 94% of the total.
In 2012, 60% of U.S. farm employers had less than $10,000 in farm labor expenses, and they collectively accounted for 4% of the $27 billion total. The 44,200 U.S. farms that each had labor expenses of $100,000 or more, 8% of U.S. farm employers, accounted for 74% of total labor expenses. California has a higher share of farms in the more than $100,000 expense category, but these large farms accounted for over 90% of farm labor expenses.
__________________________________________________________________________________
This article was originally published by Philip Martin in ARE Update, Vol.17, No. 6, July/Aug, 2014. The issue can be accessed by clicking HERE. The ARE Update is a bimonthly magazine published by the University of California Giannini Foundation of Agricultural Economics for the purpose of providing wide dissemination of research results and expert opinion from faculty and graduate students in agricultural and resource economics at UC Davis and UC Berkeley.
__________________________________________________________________________________
The COA asks farmers to report how many workers they hired directly, including family members on the farm payroll. In 2012 U.S. farmers reported hiring 2.7 million workers, including 1.7 million who were employed on their farms for less than 150 days, making seasonal workers 60% of individuals hired. Any worker employed seasonally on two farms is counted twice, although there is no duplication of wages in the reporting. California farmers reported 465,400 directly hired workers, including 260,000 or 56% who were seasonal workers.
The biggest concentration of farm workers is on less than one tenth of U.S. and California farms. The 40,600 U.S. farms that reported hiring ten or more workers accounted for almost 60% of all U.S. farm workers hired while the 7,200 California farms that each hired ten or more workers accounted for almost 85% of the state’s farm workers.
The COA reports two more farm labor items. First, it asks farmers if they hired any migrant workers, defined as persons whose farm jobs prevented them from returning to their permanent place of residence the same day. U.S. farmers reported hiring 402,000 migrants directly, making 15% of their hired workers migrants while California farmers reported 119,000 migrants, making 26% of directly hired workers migrants. However, farm employers may not know the permanent residence of their workers.
Second, the COA asks farmers to report the number of unpaid workers on their farms. More U.S. and California farms reported having unpaid workers in 2012, but the number of unpaid workers was lower than the number of paid workers. U.S. farmers reported 2.1 million unpaid and 2.7 million paid farm workers, and California farmers reported 72,000 unpaid and 465,000 paid farm workers.
The COA provides data on farm labor expenses in 2012, but farm worker employment data are reported only for workers hired directly by farmers. Nonetheless, the average number of full-time equivalent jobs in agriculture can be estimated by dividing the labor expenses of farmers by the average hourly earnings of workers to estimate hours worked. If hours worked are divided by 2,080 to get FTE jobs, average farm employment can be compared to average nonfarm employment.
Average FTE agricultural employment in U.S. agriculture estimated in this way rose 14% from 1.2 million in 2007 to 1.4 million in 2012, and average FTE farm employment in California rose 21% from 334,000 in 2007 to 405,000 in 2012. California agriculture is far more labor-intensive than U.S. agriculture. The ratio of farm sales to expenditures for directly hired and contract labor was 11.8 to one for the U.S. in 2012, and 4.3 to one in California.
The number of FTE jobs calculated using total farm labor expenses and average hourly earnings can be compared to average farm employment reported by farm employers when they pay unemployment insurance (UI) taxes. Only larger farm employers must cover their workers under UI programs in many states, and national UI-covered agricultural employment averaged 1.2 million in 2012, about 86% of FTE employment estimated using COA data. In California, where all farm employers who pay at least $100 in quarterly wages must participate in the UI program, UI-covered agricultural employment averaged 411,740 in 2012, slightly more than estimated using COA data.
Clearly, average agricultural employment is not a count of farm workers. Defining a farm worker as a person employed for wages in agriculture sometime during the year, there were about 2.5 million hired farm workers when USDA analyzed a December supplement to the Current Population Survey that was discontinued in the late 1980s, suggesting two farm workers per FTE or year-round job.
In California, a special analysis of all Social Security Numbers reported by the state’s agricultural employers found a million unique SSNs in 2001, when aver- age employment was 388,000, suggest- ing 2.5 workers per job. The number of workers employed sometime during the year exceeds average employment in seasonal industries with employment peaks and high turnover such as agriculture.
FVH Agriculture and Labor
The COA reports hired and contract labor expenses of farms by their NAICS code or primary commodity. FVH farms were 14% of U.S. farms with direct-hire labor expenses in 2012, but they accounted for 39% of labor expenses. Almost half of all U.S. farms that had labor expenses of $250,000 or more were FVH farms, but the COA does not publish the labor expenses of these large FVH farm employers, so their share of farm labor expenses is unknown. The contract labor picture is similar. FVH farms throughout the U.S. were 21% of farms with contract expenses, account for two-thirds of contract labor expenses, and were 56% of farms with over $50,000 in contract labor expenses in 2012.

Labor expenses are even more concentrated on FVH farms in California. Two-thirds of California farms with labor expenses and 57% of California farms that had labor expenses of $250,000 or more produced FVH commodities, and these farms accounted for 76% of labor expenses for workers hired directly by farmers. FVH farms were 80% of those with contract labor expenses, and they accounted for 93% of contract labor expenses. Over 85% of farms with more than $50,000 in contract labor expenses produced FVH commodities. The share of contract to total farm labor expenses averaged 41% for FVH farms, ranging from 8% for greenhouse and nurseries to about 45% for fruits and vegetables.
California dairy farms, which spent $635 million on hired labor in 2012— over 90% for directly hired workers. Half of the dairies spent more than $250,000 on hired farm workers, and a quarter hired workers via contractors. FVH farms and dairies combined accounted for 86% of California’s labor expenses for directly hired workers in 2012 and 94% of contract labor expenses. USDA reports labor data for seven crops and seven livestock commodities, from grains and cotton to beef and poultry, but in California four commodity groups account for almost all farm labor expenses.
Conclusions
The importance of FVH commodities in California agriculture makes the state the leader in farm sales. Farm production and farm worker employment are concentrated on a relatively few large farms across the U.S. and
in California, and estimates using COA data suggest that average farm employment is expanding faster in California than in the United States. In California, four of the 14 commodity groups for which the COA reports labor expenses, vegetables and melons, fruits and nuts, greenhouses and nurseries, and dairies, accounted for 86% of farm labor expenses in 2012.
Farm labor is often in the headlines, as exemplified by reports of farm labor shortages due to fewer newcomers from Mexico, unemployment in farm worker communities due to the drought, and the July 1, 2014 increase in the California minimum wage from $8 to $9 an hour. The COA, which provides the most complete profile of the state’s agriculture, suggests that farm employment is growing and will continue to garner media attention.
