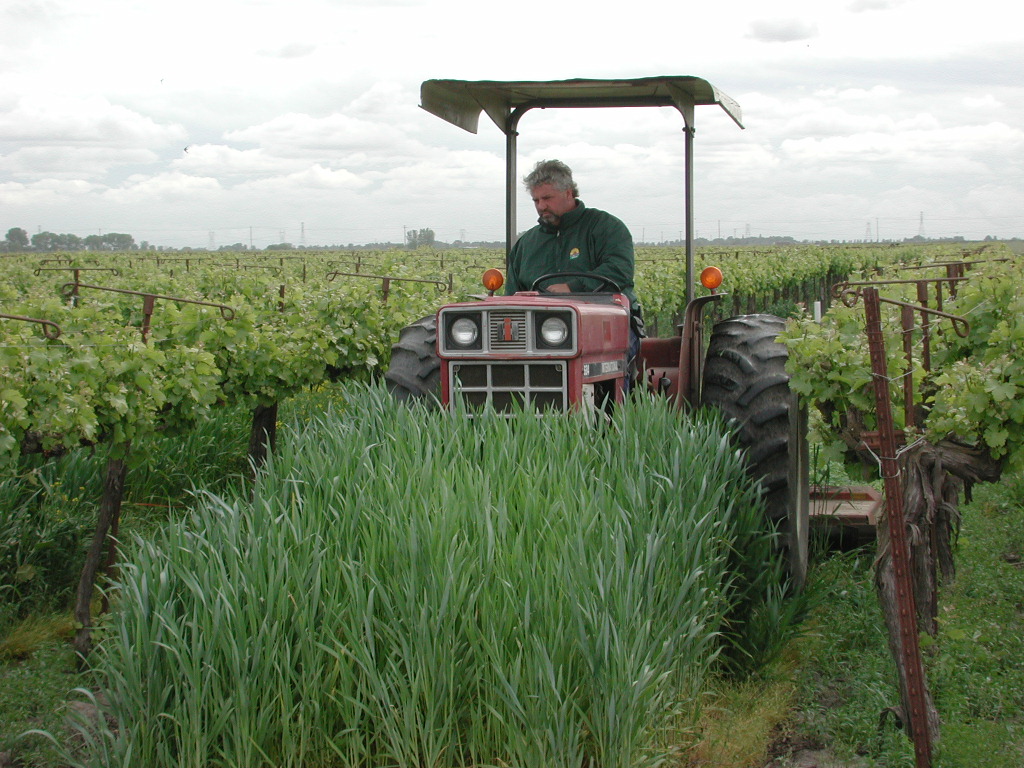
 Cover crops are a critical piece of a sustainable vineyard system. Retaining plant cover in tractor rows helps reduce soil loss, limiting wind or water erosion. [1] Cover crops also influence vineyard nutrient levels [1, 2]. The inclusion of cover crops in vineyard management plans can also result in less desirable effects such as increased greenhouse gas emissions, especially if leguminous cover crops are utilized [1, 3]. Our study in the Lodi area is looking at three different cover crop mixes to see what effect they might have on vineyard nutrient levels and emissions of the greenhouse gas nitrous oxide (N2O).
Our four treatments are 1) ryegrass; 2) a legume mix of faba and forage pea; 3) a ‘soil builder’ mix consisting of triticale, faba beans, peas, vetch, and mustard, and a 4) fallow control. Each mix was planted at a rate of 100 lbs / ac in the tractor rows in between the vine rows. The ryegrass was expected to absorb soil nitrate through the growing season. Nitrate held by plants is not accessible to soil microbes that produce N2O, potentially limiting the production of this potent greenhouse gas in addition to reducing nitrate leaching potential. However, when the ryegrass cover crop is incorporated back into the soil, the flush of N2O that might occur could outweigh this benefit. The legume mix introduces additional N into the vineyard system through N fixation from the atmosphere. Not all of this N might be accessible to the vines. However, the newly introduced N may stimulate nitrate leaching or N2O losses. The ‘soil builder’ mix was chosen to maximize additions of organic material to the soil. The ‘soil builder’ maximizes utilization of available soil resources. What cover crop best suits a grower’s need depends on soil types, nutrient status, and management histories. Here, we additionally wanted to evaluate the effects of these cover crops on greenhouse gas emissions.
__________________________________________________________________________________
Lodi winegrowers have long-since been aware of the benefits cover crops provide. According to the 2011 Lodi Winegrowers Survey (See HERE), about 55% of Lodi growers plant cover crops to accomplish various vineyard functions including dust reduction and natural predator habitat. See the Soil Management and Water Management chapters of the Lodi Winegrowers Workbook for more more information about cover crops.
__________________________________________________________________________________
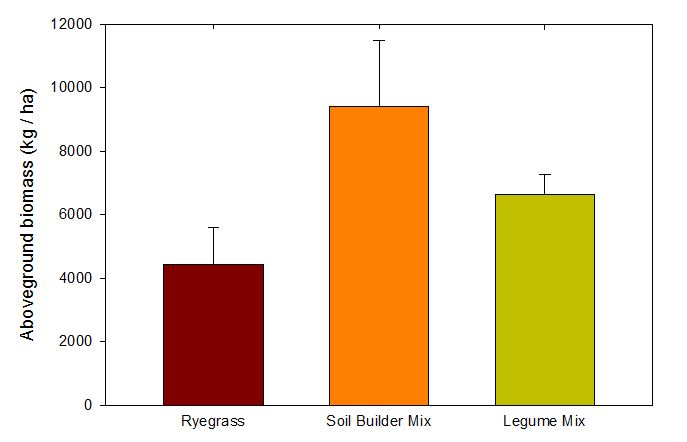
Figure 2. Total aboveground cover crop biomass.
Background on nitrous oxide
N2O is a greenhouse gas almost 300 times more potent than carbon dioxide (CO2). Soil management practices influence these emissions, most importantly nitrogen (N) fertilization, which in the United States accounts for nearly 70% of total N2O emitted [4]. Events that trigger N2O emissions include the incorporation of crop residues, tillage, irrigation, and precipitation [5-11]. These events lead to N2O production in a number of ways, primarily through the two microbial processes of nitrification and denitrification. Denitrification is the conversion of nitrate (NO3–) to other forms of nitrogen, such as the harmless dinitrogen (N2) and, as a byproduct, the greenhouse gas N2O, when soil oxygen levels are low [12]. N2O is also produced through the microbial process of nitrification, the conversion of soil ammonia into nitrate. N2O from nitrification is also mainly produced when soil oxygen levels are low [13]. Soil processes that consume oxygen, such as the presence of a carbon source and the availability of substrate under high soil moisture conditions, promote N2O production in soil. Irrigation and precipitation stimulate N2O production in two ways. First of all, water is essential for microbial reactions, and dry conditions tend to limit the rate of microbial activity. Also, when water enters the soil, it can displace soil gases including oxygen, creating conditions ripe for denitrification [10, 11, 14]. Thirdly, high soil water content limits replenishment of oxygen from the atmosphere into the soil.

Figure 3. Total nitrogen in aboveground biomass. This graph shows the total nitrogen incorporated into the soil from the portions of the aboveground cover crop biomass. It is important to note that this N is not all immediately in the soil. Rather, it becomes available over time as the plant biomass mineralizes in the soil.
Management effects on nitrous oxide emissions
Improved soil structure that can be achieved through soil organic matter inputs, such as cover cropping, benefits a soil through better aeration – resulting in less potential for low oxygen conditions that promote N2O emissions. However, the incorporation of crop residues introduces carbon and nitrogen into the soil, feeding soil microbes, and greater substrate (ammonium, nitrate) availability increases the potential for N2O production. Tillage can transform the physical distribution of microbes, making previously inaccessible nutrients available to them. When choosing cover crops, the obvious benefits of improved soil quality and management with cover cropping must be evaluated under consideration of potential N2O emissions that evolve with different mixtures. The intent of this project is to gather data that will enable growers to make informed decisions about cover crop management.
Cover crop performance
The cover crop mixes were planted on 11/10/13, prior to the first rainfall of the season which occurred on 11/19 and 11/20. The cover crops were initially limited in their growth due to the lack of precipitation. The cover crops began to increase their growth rate after rains in February and March and were terminated by mowing and tilled on 5/26/14. At that time, the ‘soil builder’ cover crop had an aboveground biomass of 9400 kg /ha, the legume mix 6600 kg / ha and ryegrass 4400 kg / ha (Figure 2). The soil builder mix and legume cover crops had approximately equal levels of N in the aboveground biomass (around 210 kg N / ha), while ryegrass biomass N was lower (144 kg N /ha (Figure 3).
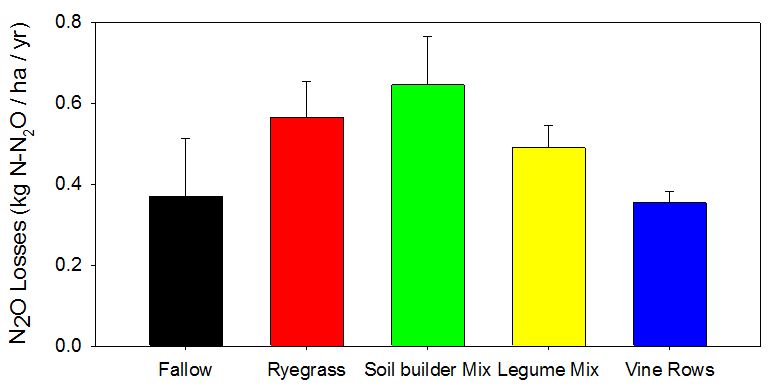
Figure 4. Total cumulative N2O emissions over one year (2013-14). The emissions are shown for bare soil (Fallow), rye grass cover cropped, ‘soil builder’ cover cropped, and legume cover cropped tractor rows, as well as in the bare vine rows.
Nitrous oxide emissions in 2013-14
The overall emissions observed in our study, both in the tractor rows and under the vines were quite low (Figure 4). After a full 12 months of observations, all three cover crop mixes did not significantly increase cumulative N2O emissions as compared to leaving the soil fallow in spite of the relatively large inputs of nitrogen and carbon through the cover crop biomass. Previous studies on the effect of cover cropping have had mixed results [3][15], though in at least one study in California, leguminous cover crop mixes dramatically increased N2O emissions following the first rainfall of the season [16], an observation that has so far not been repeated in our study. The N2O emissions observed both for the cover cropped tractor rows as well as the vine rows were relatively low compared to those in other California cropping systems being monitored by our laboratory. These low levels of emissions are in line with those of most other studies [17].
Soil inorganic N
Soil inorganic N levels in the surface layer (0-15 cm) fluctuated greatly through the year with large variations in space and time (Figure 5). Initial soil nitrate readings taken in February of 2014 were around 50-60 mg / kg soil. After rainfall received in mid-February 2013, the nitrate levels plummeted to around 5 mg / kg soil. Nitrate readings remained at this low level through the end of April, when they began to rise throughout the dry season until peaking in October. By mid-November, soil nitrate levels bottomed again at around 20 mg / kg soil. Soil ammonium levels were almost non-detectable until the end of April, when they began a steady rise until July. After July, soil ammonium levels fluctuated greatly between dates.
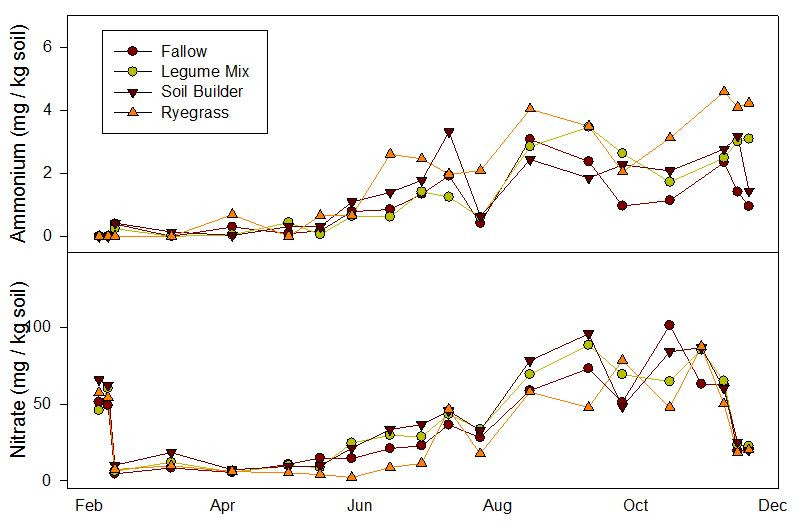
Figure 5. Soil surface layer nitrogen levels. These graphs show the fluctuation in soil inorganic N levels in the 0-15 cm layer over the course of the study.
Citations
- Ingels, C., et al., Selecting the right cover crop gives multiple benefits. California Agriculture, 1994. 48(5): p. 43-48.
- Steenwerth, K. and K.M. Belina, Cover crops and cultivation: Impacts on soil N dynamics and microbiological function in a Mediterranean vineyard agroecosystem. Applied Soil Ecology, 2008. 40(2): p. 370-380.
- Basche, A.D., et al., Do cover crops increase or decrease nitrous oxide emissions? A meta-analysis. Journal of Soil and Water Conservation, 2014. 69(6): p. 471-482.
- USEPA. Inventory of US Greenhouse Gas Emissions and Sinks: 1990-2011. 2013; Available from: http://www.epa.gov/climatechange/Downloads/ghgemissions/US-GHG-Inventory-2013-Chapter-6-Agriculture.pdf.
- Baggs, E.M., et al., Nitrous oxide emission from soils after incorporating crop residues. Soil Use and Management, 2000. 16(2): p. 82-87.
- Burger, M., et al., Microbial responses and nitrous oxide emissions during wetting and drying of organically and conventionally managed soil under tomatoes. Biology and Fertility of Soils, 2005. 42(2): p. 109-118.
- Chen, H., et al., Soil nitrous oxide emissions following crop residue addition: a meta-analysis. Glob Chang Biol, 2013. 19(10): p. 2956-64.
- Davidson, E.A., Sources of Nitric Oxide and Nitrous Oxide following Wetting of Dry Soil. Soil Sci. Soc. Am. J., 1992. 56(1): p. 95-102.
- Eichner, M.J., Nitrous Oxide Emissions from Fertilized Soils: Summary of Available Data. J. Environ. Qual., 1990. 19: p. 272-280.
- Guo, X., et al., The Extent of Soil Drying and Rewetting Affects Nitrous Oxide Emissions, Denitrification, and Nitrogen Mineralization. Soil Sci. Soc. Am. J., 2014. 78(1): p. 194-204.
- Trost, B., et al., Irrigation, soil organic carbon and N2O emissions. A review. Agronomy for Sustainable Development, 2013. 33(4): p. 733-749.
- Richardson, D., et al., Mitigating release of the potent greenhouse gas N2O from the nitrogen cycle – could enzymic regulation hold the key? Trends Biotechnol, 2009. 27(7): p. 388-97.
- Zhu, X., et al., Ammonia oxidation pathways and nitrifier denitrification are significant sources of N2O and NO under low oxygen availability. Proceedings of the National Academy of Sciences of the United States of America, 2013. 110(16): p. 6328-6333.
- Ruser, R., et al., Emission of N2O, N2 and CO2 from soil fertilized with nitrate: effect of compaction, soil moisture and rewetting. Soil Biology and Biochemistry, 2006. 38(2): p. 263-274.
- Garland, G.M., et al., Direct N2O emissions following transition from conventional till to no-till in a cover cropped Mediterranean vineyard (Vitis vinifera). Agriculture Ecosystems & Environment, 2011. 144(1): p. 423-428.
- Garland, G.M., et al., Direct N2O emissions from a Mediterranean vineyard: Event-related baseline measurements. Agriculture Ecosystems & Environment, 2014. 195: p. 44-52.
- Garland, G.M., et al., Direct N2O emissions from a Mediterranean vineyard: Event-related baseline measurements. Agriculture, Ecosystems & Environment, 2014. 195(0): p. 44-52.
