 California’s role as the nation’s leading producer of agricultural products is well known. In 2012 California’s farms and ranches accounted for $42.6 billion in output. California produced 15% of the nation’s total value of crop production and 7.1% of the value of livestock and livestock products. Milk production was the state’s largest agricultural industry in 2012, with production valued at $6.90 billion in 2012, followed by grapes at $4.45 billion, and almonds at $4.35 billion. Nursery plants with $3.54 billion in value and cattle and calves at $3.30 billion rounded out the top five.
Most people, however, are probably less familiar with the state’s vitally important food and beverage processing sector, which is responsible for acquiring the bounty produced on California’s farms and ranches and converting it to the food, beverage, and fiber products demanded by consumers worldwide. Our study quantifies the economic impact of this integral component of California’s economy. Food and beverage processing is California’s third largest manufacturing sector, following computers and electronics and chemicals, and California’s total of 3,421 food manufacturing establishments is the largest in the nation. In 2012 California’s food and beverage processors accounted for $82 billion of value added and 760,000 full- and part-time jobs.
__________________________________________________________________________________
Food and beverage processing is the third largest manufacturing sector in California. In 2012 California’s food and beverage processing sector contributed $82 billion in value added to the California economy, 760,000 full- and part-time jobs, $10.5 billion in federal tax revenues, and $8.2 billion in state and local tax revenues.
__________________________________________________________________________________
Conclusion
Food and beverage processing is a key engine of the California economy and an indispensable complement to California’s agricultural production sector. In 2012 California’s food and beverage processors contributed directly or indirectly, through multiplier impacts, $82 billion of value added and 760,000 jobs to the California economy. Food and beverage processing is a key driver of many county economies, in several instances accounting for 20% or more of total employment.If food and beverage production and demand growth trends continue, as we expect they will, the impacts of the sector on value added, output, and employment reported here will soon understate the sector’s true impacts. However, the multiplier values included in this article reflect the underlying fundamentals of the state and local economies analyzed in the study and should be relatively stable over time. Thus, it will be possible for future analysts to update this work by applying the multipliers to current information on the value of production in the different jurisdictions and industrial sectors included in this study.
 Multiplier Impacts
A key part of any impact study is estimating the secondary or multiplier impacts from economic activity. These impacts occur as the value added from the primary economic activity, food and beverage processing in our case, reverberates through the local and regional economies, creating additional income and employment for the businesses. These businesses supply inputs to the primary activity, and for commercial enterprises generally, as income earned is spent on a multitude of products and services in the local or regional economy.
We estimated these secondary impacts using regional and interregional input-output models. These models provide a snapshot of a state or regional economy by tracing relationships among commercial sectors, as well as government, households, and the rest of the world. Input-output models provide measures of the multiplier or spillover effects attributable to a primary economic activity. These spillover impacts are broken down into two main categories: indirect and induced effects.
Indirect effects are changes in local inter-industry spending transmitted through economic linkages among the different sectors of the economy. For example, a food processor that contracts with local businesses to provide containers and packing materials, or to ship farm products to the plant and finished products to markets, creates income and value added for those enterprises.
Induced effects are the result of spending household incomes generated from the sectors directly and indirectly affected by the primary economic activity. Thus businesses, such as retail shops and service providers, that may seem quite disconnected to food and beverage processing, benefit from the presence of these enterprises in the local economy through the income they generate that is then spent in these establishments.
The magnitudes of both indirect and induced impacts are determined by the degree to which income “leaks” from the local economy by being spent outside its boundary. Naturally, the larger and more economically developed the area of consideration, the smaller is the rate at which economic activity leaks beyond its boundary. Thus, multiplier impacts will be greater when we are considering California as a whole than when we are examining individual counties.
We utilized the Impact Analysis for Planning (IMPLAN) model to estimate the multiplier impacts generated by the food and beverage processing industry in California. The IMPLAN model is one of the most widely used and respected models for regional economic analysis, and it is utilized extensively in economics, planning, and engineering studies to estimate the full economic impacts of injections or withdrawals of economic activity from regions of interest.
__________________________________________________________________________________
This article was originally published by the authors in ARE Update, Vol.18, No. 4, March/April, 2015. The issue can be accessed by clicking HERE. The ARE Update is a bimonthly magazine published by the University of California Giannini Foundation of Agricultural Economics for the purpose of providing wide dissemination of research results and expert opinion from faculty and graduate students in agricultural and resource economics at UC Davis and UC Berkeley.
__________________________________________________________________________________
Results
We estimate that in 2012 the food and beverage processing sector directly accounted for nearly $25.2 billion in value-added activity and a total value added of $82 billion, once indirect
and induced impacts are included. The food and beverage processing sector was responsible for over 760,000 jobs in 2012, over 198,000 of them being directly in food and beverage processing and another nearly 563,000 through indirect and induced employment impacts. Based upon its direct value-added contribution, the food and beverage processing sector is the third largest manufacturing sector in California, comprising 9.2% of the state’s manufacturing value added, and trailing only electronic and computer equipment (34.5%) and chemical manufacturing (15.8%).
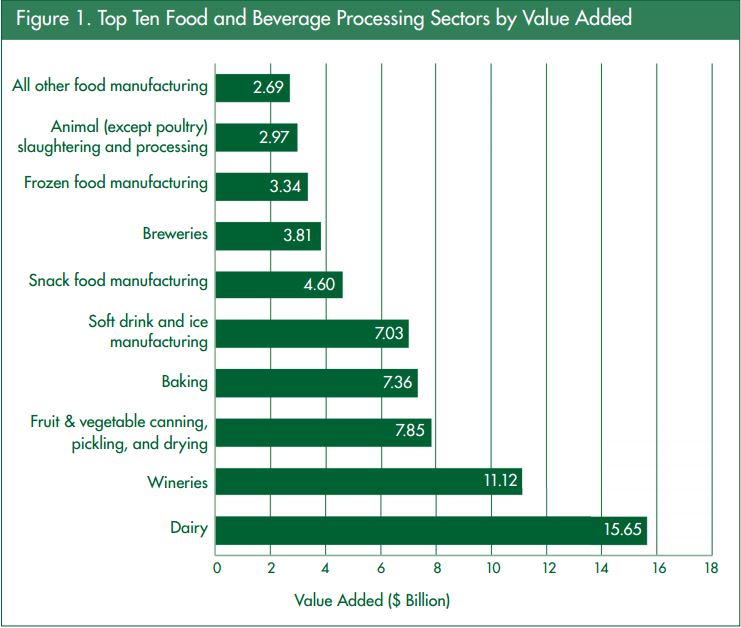
Figure 1 summarize the economic impacts for California’s 10 leading food and beverage processing sectors for 2012. With milk production being California’s largest agricultural industry, it is no surprise that dairy is the state’s leading food processing industry. Dairy processing directly accounted for $3.37 billion in value added. Once the multiplier impacts from the sector’s activities are included, the total economic impact of dairy processing in California is $15.6 billion. We estimate that the dairy sector directly accounts for 18,000 jobs, and that another nearly 122,000 jobs are generated from the indirect and induced impacts, resulting in over 139,000 California jobs that can be traced directly or indirectly to the dairy processing sector.
Rounding out the top five California food and beverage processing sectors for 2012, in terms of value added, were baking (comprised of bread and bakery product manufacturing; cookie, cracker, and pasta manufacturing; and tortilla manufacturing); fruit and vegetable canning, pickling, and drying; and soft drink and ice manufacturing. These sectors were responsible for $2.64 billion, $2.22 billion, and $1.72 billion in direct value-added activity, respectively. In terms of employment, the baking sector accounted directly or indirectly for more than 89,000 jobs, the fruit and vegetable canning, pickling, and drying sector was responsible for another 73,000 jobs, and total employment due to the soft drink and icemanufacturing sector was about 58,000.Grape production, California’s second largest agricultural industry in 2012, goes into producing wine and other grape beverages, table grapes, and raisins. Wineries represent California’s second-leading food and beverage processing sector, accounting for $3.65 billion in direct value added in 2012. The multiplier for wineries is estimated to be 3.05, meaning indirect and induced impacts accounted for an additional $7.4 billion in value added in 2012. California wineries were directly or indirectly responsible for just over 100,000 jobs in 2012.
 Impacts in Selected Counties
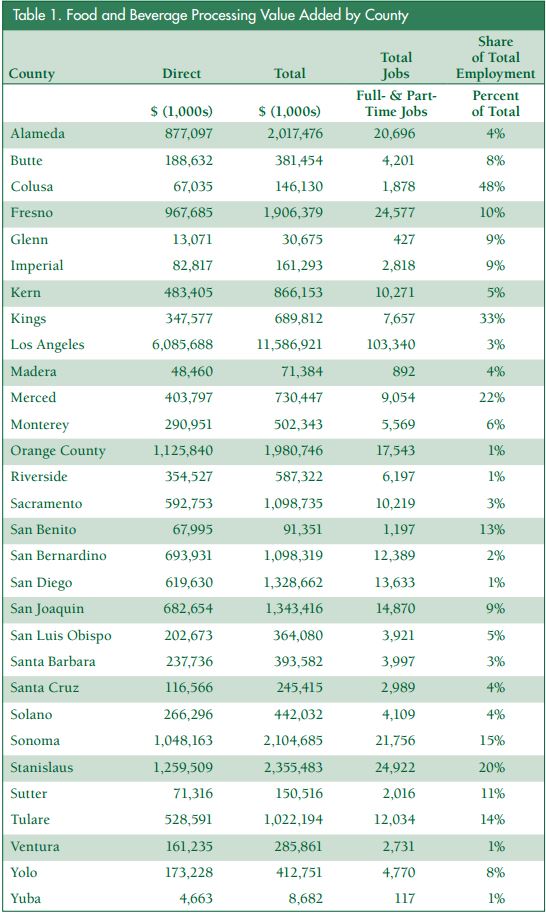
Table 1 reports economic impacts from food and beverage processing for 30 individual counties in California. The counties were chosen based upon the importance of food and beverage processing in these local economies. The direct value added due to food and beverage processing in these 30 counties accounts for 72% ($18.1 billion) of the statewide total, with Los Angeles County alone accounting for 24% of the state’s direct value added. These 30 counties are responsible for 86% of direct food and beverage processing sector jobs in the state.
Among the 30 counties included in the table, Stanislaus County is second in terms of total value-added activity, employment, and sector output. Stanislaus accounted for nearly $1.3 billion in direct value-added economic activity in 2012, with indirect and induced impacts accounting for another more than $1 billion in value-added output. Food and beverage processing in Stanislaus County was responsible for nearly 25,000 total jobs in 2012 and generated more than $8.6 billion in sector output.
Rounding out the top five food and beverage processing counties included in the study, in terms of direct valueadded economic activity, were Orange ($1.13 billion), Sonoma ($1.05 billion), and Fresno ($967 million). Food and beverage processing in Fresno County was directly and indirectly responsible for over 24,500 jobs; the comparable number for Sonoma County is 21,700 jobs. Alameda County, responsible for about 20,700 jobs, replaces Orange County in the top five, based on the employment metric.
Column 5 in Table 1 reports the percentage of total jobs in a county due directly or indirectly to the food and relative impact of food and beverage processing is in Colusa County, where
the sector is responsible for nearly half (48%) of all jobs in the county. Food and beverage processing is responsible for 20% or more of all jobs in Kings, Merced, and Stanislaus counties.
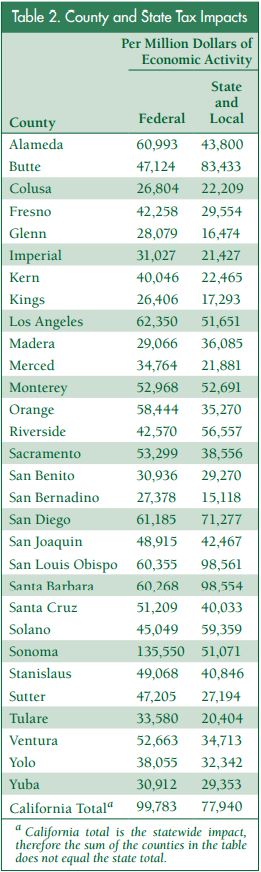
Tax Revenues Generated
California’s food and beverage processing sector is also an important contributor to tax revenues at all levels of government. Table 2 provides estimates of tax revenues generated by food and beverage processors in each of the 30 counties included in the study and for the entire state. The results are presented as total tax revenues generated per million dollars of direct output in the food and beverage processing sector. The tax revenues reported in the table account for the taxes generated from direct, indirect, and induced impacts. This presentation is convenient for policy analysis because any policies that will impact sales in the food and beverage processing sector, either positively or negatively, can be readily converted into impacts on tax revenues.
We see that statewide, each million dollars in output by the sector generates nearly $100,000 in additional federal taxes and nearly $78,000 in additional state and local taxes. In total, we estimate that statewide the sector is responsible, directly or indirectly, for $10.5 billion in federal tax revenues and $8.2 billion in state and local tax revenues.
Results vary for the individual counties based upon a number of factors, including types of food and beverage processors located in the county, structure of taxation at the local level, and income distribution within the population base. The greatest impact on federal tax revenues per million dollars in output is in Sonoma County, with nearly $136,000 in tax revenues generated. The greatest impacts on state and local tax revenues occur in San Luis Obispo and Santa Barbara Counties, where a million dollars in output generates nearly $100,000 in state and local tax revenues.
Methodology
We derived value added for food and beverage processing as the value of the products produced by the food and beverage sector, less the cost of inputs used in producing those products. By deducting input costs, we avoid double counting the economic impact of agricultural production and are able to focus solely on the processing sector. All measures of impact reported in this study are annual estimates for 2012 (the most recent year for which full information was available at the time the study was conducted), with all impact measures reported in nominal U.S. dollars and all employment estimates reported as annual jobs, including fulltime, part-time, and seasonal jobs.
