Remote sensing is a valuable tool for vineyard managers to assess several aspects of their viticultural operations, including pest management programs. Remote sensing refers to the use of aircraft or satellites to provide pictures or digital images of vineyards. Synoptic images taken from above vineyards often provide insight into patterns in vine growth that are more difficult to discern from the ground. Subtle differences that may go unnoticed in the field may be seen as significant in a remotely sensed image.
Remote-Sensing Options
Color infrared photography from aircraft flying above the vineyard is a form of remote sensing that has been in use for decades. Color infrared film records reflectance in the green and red wavelengths of visible light, and in the near infrared (NIR) range. It does not react to heat or temperature differences in plants. Green plants absorb most of the red light that reaches them, but they reflect both green and NIR wavelengths. Green plants are the only objects with this combination of absorption and reflectance, thus they are the only objects that appear as a shade of red or magenta on the film. The shade depends on the cultivar, maturity, and health of the plant. The leaf ’s internal cell structure is responsible for reflectance of NIR radiation, so conditions that alter cell structure, such as water stress or disease may lower the NIR reflectance. The future use of color infrared film photography will likely become less common with the decline in availability from film manufacturers.
__________________________________________________________________________________
Click HERE to purchase your copy of Grape Pest Management.
 The Lodi Winegrape Commission and the University of California Division of Agriculture and Natural Resources (UC ANR) are partnering to provide Lodi winegrowers with the latest information about grape pest management. This is the first of several excerpts from the third edition of the Grape Pest Management book to be published here in the Coffee Shop.
In Grape Pest Management, more than 70 research scientists, cooperative extension advisors and specialists, growers, and pest control advisors have consolidated the latest scientific studies and research into one handy reference. The result is a comprehensive, easy-to-read pest management tool.
The new edition, the first to be published in over a decade, includes several new invasive species that are now major grape pests. It also reflects an improved understanding among researchers and growers about the biology of pests. With nine expansive chapters, helpful, colorful photos throughout, here’s more of what you’ll find:
- Diagnostic techniques for identifying vineyard problems
- Detailed descriptions of more than a dozen diseases
- Comprehensive, illustrated listings of insect and mite pests,including the recently emerging glassy winged sharpshooter and Virginia creeper leaf-hopper
- Regional calendars of events for viticultural management
- Up-to-date strategies for vegetation management
This excerpt from Grape Pest Management (Third Edition) was published with permission from UC ANR, and was written by Edward Webber, Larry Bettiga, Lee Johnson, and Mark Battany.
__________________________________________________________________________________
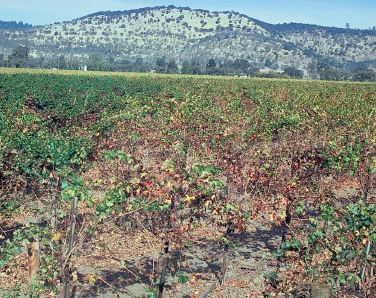
Figure 6.1: This ground-level photo (from the roof of a car) was taken in the direction of the arrow in figure 2.6. The boundary between green and yellow vines is much less striking than in the aerial photo. Photo: W.E. Wildman.
Digital imagery from cameras mounted on aircraft or satellites is a remote-sensing tool that has many additional uses beyond pest management. Digital imaging systems differ from conventional photography in that multispectral digital cameras measure energy reflected from the earth in several distinct spectral channels in the visible and NIR ranges. In contrast, traditional film photography generates a single image. The spectral information of digital images is recorded as a matrix of numbers, with each number indicating the brightness of each picture element, or pixel. The cameras typically record in blue, green, red, and NIR wavelength bands. Data collected from each channel can be compared, combined, or manipulated mathematically to generate useful images for vineyard managers.
Digital airborne imagery is typically georegistered to a ground coordinate system so that it can be readily combined with other site information using geographic information system (GIS) software to generate detailed maps and images for a variety of decision-making purposes. GIS can incorporate a wide array of information about vineyard blocks (cultivars, rootstocks, irrigation, fertilization, crop production, soils, slope, history, etc.) that when combined with aerial imagery can provide clues to understanding differences in vine performance that might not be obvious in the field. The derived map products can provide growers a broader perspective on vineyard performance than would be available from a simple photographic print.
Several types of spectral vegetation indices have been developed to maximize sensitivity to vegetation amount and condition. These indices integrate multiwavelength data at each pixel to a single value. Images can then be created based on the index values. One type of image often produced through digital imagery is based on the normalized difference vegetation index (NDVI). The NDVI closely relates to leaf area and provides a useful indicator of overall canopy development and vine vigor. It is derived from red and NIR wavelengths as follows:
NDVI = (NIR − red) ÷ (NIR + red)
Because green plants typically reflect more NIR (and less red) energy than soil, NDVIs are very useful in crops such as grapes where large amounts of soil show between the rows of plants.
Colors in NDVIs and other map products are assigned by the software user or image provider and may vary from image to image. For instance, a low-vigor vine may be colored red in one set of images and yellow in another. It is important to refer to the color key for each digital image to ensure its proper interpretation.
Using Remote Imagery
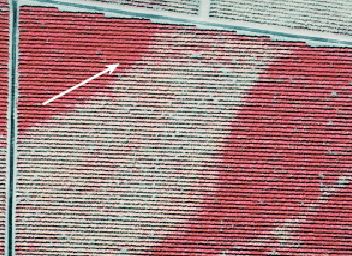
Figure 6.2: The sharp boundary in the color of vines is caused by a subsoil gravel layer that reduces the available water to the vines below the arrow. This effect, not always noticable in midsummer, becomes obvious in late September or October. Photo: J. Caylor, U.S. Forest Service.
Two requirements of successful pest management are identification of where the problem is located in the vineyard and proper diagnosis of the causes. Remote sensing technology can aid in both areas.
Aerial imagery is very useful for identifying variations in vine growth across vineyards, as well as identifying and mapping changes that take place from year to year. Differences in vine growth may appear in patterns that are regular or random. Regular patterns with straight lines or geometric shapes are usually related to differences in grape cultivar between vineyard blocks; the types of training or trellis systems used; vigor differences due to rootstocks, irrigation or fertilization practices; or other factors related to specific blocks. Patterns that are random or irregular are more likely to be caused by soil differences or related to disease or insect problems. Whether the patterns are regular or random, the causes of growth differences must be diagnosed using all available information about the blocks combined with on-the-ground inspections.
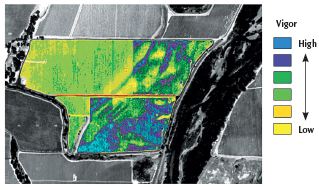
Figure 6.3: NDVI image of a vineyard adjacent to a river. The streaky appearance shows the effect of deposition of alluvium with a relatively high water-holding capacity. Photo: J. Hutton, Grayhawk Imaging.
Problem areas with weak vine growth may first be identified in a remotely sensed image. This is especially true in large vineyards or in those with greater levels of mechanization, where field crews spend less time in each block. In addition to identifying areas with reduced canopy growth, images may show patterns of vine growth that provide clues as to the causes of poor vine performance. Year-to-year changes can be an important aid in diagnosing problems and can help separate pest problems from the effects of soil conditions. Remote sensing can also be used to monitor the effectiveness of subsequent remediation efforts.
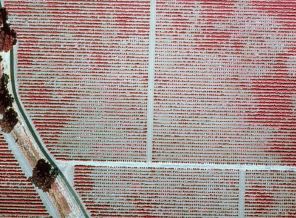
Figure 6.5: After 8 years, most vines affected by phylloxera are still alive, yet are so reduced in size that no crop is produced. Photo: W.E. Wildman.
Soil factors often contribute to significant differences in vine growth by influencing the vine root system and affecting water and nutrient uptake. Variations in soil texture, depth, drainage, and water-holding capacity can result in striking differences in vine size and color. Where vines have limited water availability due to shallow root zones or coarse-textured soils, vines are smaller and leaves may turn prematurely yellow (fig. 6.1). Areas of weak growth due to soil conditions are often apparent in color infrared (fig. 6.2) and NDVI (fig. 6.3) images. Management factors such as nonuniform irrigation delivery, fertilizer applications, and cultivation practices can also affect vine growth that may be evident in remotely sensed images, and information gleaned from them can be used to modify future practices.
Pests and diseases that affect vine growth and vigor can be detected through remote sensing. This includes soil pests such as phylloxera and nematodes that weaken vines by feeding on the roots, as well as diseases such as Armillaria root rot and Pierce’s disease that can weaken and kill vines.
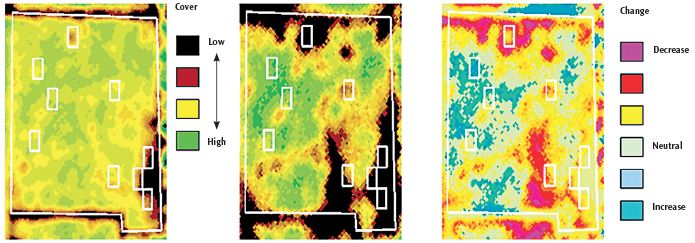
Figure 6.6: Phyloxera infestation. NVDI images showing vineyard cover in a 5 ha (12 ac) block in year 1 (left) and year 2 (middle). Relative change from year 1 to year 2, shown in the right image, indicates a decrease in cover in the yellow, red, and purple areas. Photo: L.F. Johnson.
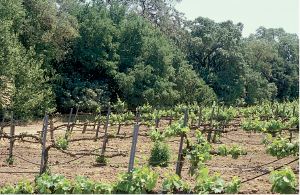
Figure 6.7: Ground-level photo of a vineyard near riparian area impacted by Pierce’s disease, with the greatest vine damage occurring adjacent to the riparian zone. Photo: R.J. Smith.
Vines weakened by phylloxera or nematodes are smaller than uninfested vines, and affected areas often increase in size over time. These differences can be seen in color infrared photos (fig. 6.5) and in NDVI images. Digital data in NDVIs can be compared from year to year to create change images, as shown in figure 6.6.
Pierce’s disease kills grapevines and often occurs in patterns related to the habitat of its insect vectors. In northern California, Pierce’s disease is often associated with riparian areas, with the greatest vine damage occurring adjacent to the riparian zone (fig. 6.7). This pattern is often most apparent in aerial images (fig. 6.8).
Armillaria root rot kills vines, which is apparent in remote imagery (fig. 6.9). It usually occurs in relatively small areas that might appear anywhere in a block as a result of infected roots or woody debris remaining in the soil. These weakened areas may never support healthy vines, but they rarely increase in size to any great degree. However, in smaller plantings, such areas may make up a significant proportion of the total number of vines.
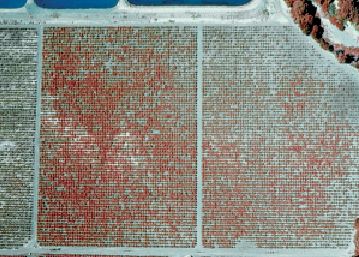
Figure 6.8: The pattern of Pierce’s disease shown in this aerial photo is typical in grape-growing regions in which the blue-green sharpshooter is the principal vector of the bacterium that causes the disease. Vines closest to the riparian habitat of the sharpshooter leafhopper have died, while those farther from the stream are less affected. Photo: W.E. Wildman.
Vines weakened from nematode damage may have a similar appearance to drought-stressed vines in an NDVI image (fig. 6.10). If a weak area increases in size in subsequent years, one might suspect a biological cause, such as phylloxera feeding on the roots, rather than a static difference in soil type. The differences between weak and healthy vines are very apparent in remote imagery, and patterns often emerge that are not apparent from ground level. The use of imagery can simplify diagnoses and help ensure proper treatment.
Remote sensing can identify and map areas of poor or variable vine growth and track their development over time, but it does not explain the causes of poor vine performance. For this, the vineyard manager must interpret the information provided by the imagery and follow up with on-the-ground investigations.
Additional Uses
Remote sensing has many additional uses beyond pest management. Imagery can be used to track changes in vine performance over time after management actions such as increased fertilization, adjusted irrigation scheduling, or modified vineyard floor management practices. Imagery can also help identify representative areas within a vineyard that are appropriate for annual testing of petioles for nutritional appraisals.

Figure 6.9: Armillaria root rot has killed vines in an area where an oak tree was standing prior to the vineyard being planted. In contrast to phyloxera, the spread of this disease is relatively slow and progresses outward in concentric rings. Photo: W. E. Wildman.
Variability in vine growth and development occurs in every vineyard. Variability may arise from many factors, including changes in soil type or depth, differences in water availability, vine age, weeds and cover crops, cultural practices, crop load, rootstocks, pests, diseases, to name only a few. A goal for most vineyard managers is to minimize this variability or to manage it in such as way as to increase the overall uniformity of fruit quality. In order to reduce variability, it is necessary to characterize the nature of the variability, determine the sources responsible for it, and take corrective measures, if possible.
Many wineries use remote sensing to improve wine quality by differentially harvesting blocks based on NDVIs indicating vine vigor (fig. 6.11). Such NDVI images have also been correlated with soluble solids and phenolic levels in red wine grape cultivars. Images can provide winemakers with a better understanding of differences in vine vigor within blocks and across vineyards, allowing them to differentially sample and harvest sections of the vineyard that are similar to one another. By allowing different sections to ripen to the same extent prior to harvest, overall wine quality can be increased. Blocks that historically had produced average-quality wines when picked all at one time may generate wines of markedly higher quality when picked on the basis of uniform maturity.
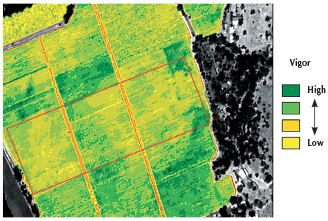
Figure 6.10: Nematode infestation. This NDVI image shows areas of depressed vine growth as yellow to brownish areas across the center of the image in all three main blocks. Photo: J. Hutton, Grayhawk Imaging.
Remote sensing is also being used in conjunction with GIS mapping and spatial analysis in the design of vineyard developments. A property’s slope and aspect are two of the considerations used to determine block layout and row direction with the objective of maximizing uniformity of vine vigor within blocks. Soil structure, chemistry, and fertility data can be generated from backhoe observation pits placed in locations relative to changes in natural vegetation for new developments or vine growth in redevelopments. These data are also used to determine block size as well as irrigation and drainage system design, planting density, and rootstock selection.
Conclusion
Remote sensing is a valuable tool for detection and monitoring of some pests and diseases in vineyards, as well as for identifying variability due to soil changes, irrigation practices, and other factors. The examples given here are just a few of the many conditions that can be recognized with relative ease by studying aerial images. Successful interpretation of the images and development of management plans require expertise in viticulture, soils, irrigation, and pest management.
References

Figure 6.11: Harvest management zones resulting from topography in hilly 2.5 ha (6 ac) Chardonnay block as shown by NDVI imagery. Low- and moderate-vigor zones produced “reserve” quality wine, while the high-vigor zone produced lower “distinct” quality. Photo: Johnson et al. 2001.
- Johnson, L., D. Bosch, D. Williams, and B. Lobitz. 2001. Remote sensing of vineyard management zones: Implications for wine quality. Applied Engineering in Agriculture 17:557–560.
- Johnson, L., B. Lobitz, R. Armstrong, R. Baldy, E. Weber, J. DeBenedictis, and D. Bosch. 1996. Airborne imaging aids vineyard canopy evaluation. California Agriculture 50(4): 14–18.
- Lamb, D. W., M. M. Weedon, and R. G. V. Bramley. 2004. Using remote sensing to predict grape phenolics and colour at harvest in a Cabernet Sauvignon vineyard. Australian Journal of Grape Wine Research 10:46–54.
- Nemani, R., L. Johnson, and M. White. 2006. Application of remote sensing and ecosystem modeling to vineyard management. In A. Srinivasan, ed., Handbook of precision agriculture: Principles and applications. Chap. 15. New York: Haworth Press.
- Wildman, W. E., K. W. Bowers, and L. J. Bettiga. 1992. Aerial photography in vineyard pest, soil and water management. In D. L. Flaherty et al., eds., Grape pest management. Oakland: University of California Division of Agriculture and Natural Resources Publication 3343. 32–38.
- Wildman, W. E., R. T. Nagaoka, and L. A. Lider. 1983. Monitoring spread of grape phylloxera by color infrared aerial photography and ground investigation. American Journal of Enology and Viticulture 34(2): 83–94.
