 The California grape and wine community, like many other agricultural and business sectors, is increasingly interested in better understanding its ‘carbon footprint’. A carbon footprint can be defined as a comprehensive measure of the amount of greenhouse gases (GHGs) produced and consumed, and is used to determine whether or not individual operations are contributing to the increase of GHGs in the atmosphere. Some vineyard operations, such as tractor driving, “produce” the GHG carbon dioxide (CO2). Indeed, the key agricultural sources of atmospheric CO2 are the combustion of fossil fuels and soil management practices that increase the decomposition of soil organic matter. The growing of grapes, however, also “consumes” CO2 through photosynthesis. For this reason and others, agriculture, including grape growing, is a significantly smaller source of CO2 than transportation and other industries. However, assessing a carbon footprint for an individual vineyard is more complex.
Agricultural activities emit two additional GHGs – nitrous oxide (N2O) and methane (CH4). The main GHG produced by viticulture is likely N2O. It is generally believed that the CH4 footprint in vineyards is insignificant. The importance of N2O comes from its strong ability to act as a GHG. N2O is roughly 300 times more effective than CO2 at trapping heat in the Earth’s atmosphere, so a small amount of N2O can cause as much global warming as a very large amount of CO2. To calculate a carbon footprint according to the protocol outlined by the International Panel on Climate Change (IPCC) requires the assessment of all GHGs combined into a cumulative, representative number, where non-CO2 emissions such as CH4 and N2O are converted to CO2 equivalents. For example, this is done for N2O by multiplying the amount of emissions by its global warming potential (how much better it is at trapping heat than CO2, or 300). Thus, in terms of equivalents, one kg of N2O equals 300 kg of CO2.
Besides being a source of GHGs, agricultural systems can help offset emissions by the long-term storage of carbon in vegetative structures and soils. This process is referred to as carbon sequestration, and according to some models, perennial crops like vineyards and orchards are expected to sequester more carbon than annual crops. Vineyard establishment and management practices can differentially influence the amounts and relative proportions of vineyard GHG emissions and carbon sequestration and, thus, can be adapted to reduce emissions and increase carbon storage to achieve a more desirable balance.
______________________________________________________________________________________
This article was originally published by the California Sustainable Winegrowing Alliance and can be viewed HERE
______________________________________________________________________________________
Vineyard Practices and Carbon Footprints
This document details the relationship between vineyard management practices and carbon footprints. For some practices below, GHG and carbon sequestration calculation tools can be used to indicate how farming practices influence the vineyard carbon footprint. For instance, the USDA Voluntary Reporting Carbon Management Tool, known as COMET-VR, shows the carbon equivalent emissions saved from reducing or eliminating tillage in annual crops. Another useful tool is the International Wine Industry Greenhouse Gas Protocol and Accounting Tool, developed by Wine Institute and international partner organizations, which allows the calculation of estimated vineyard and winery GHG emissions. Because these tools are in development, and impacts of site-specific factors such as soil type, climate, rootstock, variety, and vineyard age on GHG emissions are not fully understood, it currently is not possible to definitively evaluate the emissions for every management practice. However, use of the tools provides understanding about how carbon accounting works. Nevertheless, a number of vineyard activities clearly affect GHG emissions, for which current understandings and mitigation tactics are described below.
Fossil Fuel Combustion
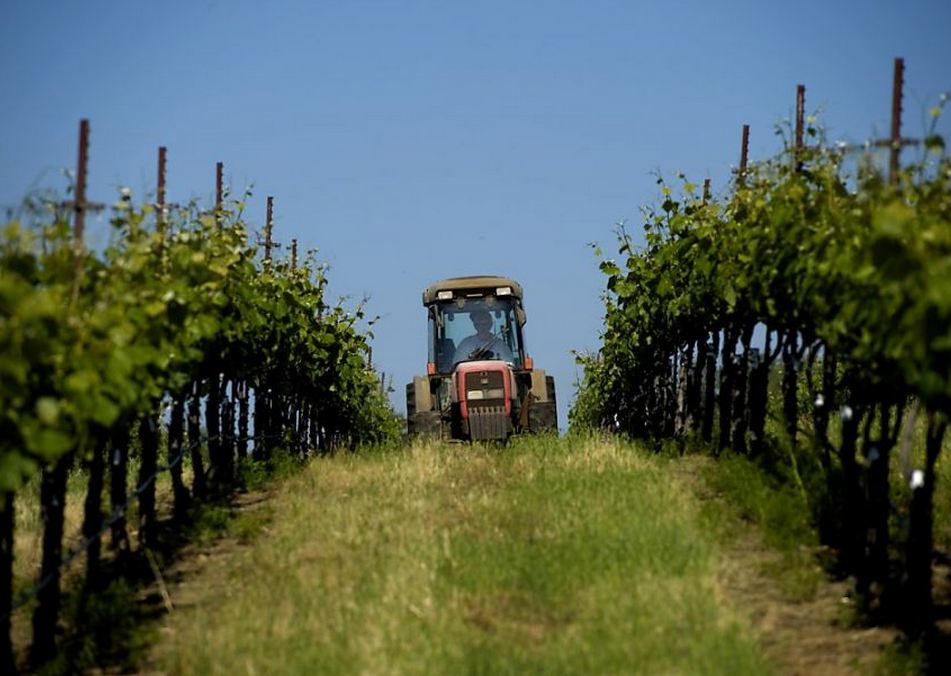
Photo: SF Gate
The combustion of fossil fuels during the operation of tractors, ATVs, irrigation pumps, and other farm equipment often constitutes a large source of the vineyard GHG footprint. Different fossil fuels are associated with different amounts of GHGs. However, all fossil fuels, including cleaner-burning natural gas, combust to produce significant amounts of CO2 and variable quantities of other GHGs like N2O. Although it has a greater energy content per unit volume, diesel produces more CO2 and N2O than gasoline, natural gas, or propane. Reducing fuel usage is one of the most obvious and effective ways to reduce the vineyard GHG footprint. Any reduction in tractor passes, for example, diminishes the carbon footprint.
GHG Estimates from Combustion of Fossil Fuels
- Diesel produces 12 kg CO2 equivalents (CO2 + N2O + CH4)/gallon
- Gasoline produces 10.5 kg CO2 equivalents/gallon
- Propane produces 8.5 kg CO2 equivalents/gallon
- Natural gas produces 1.5 kg CO2 equivalents/meter3
Nitrogen Fertilizer Applications
Another important source of vineyard GHG emissions is the use of nitrogen fertilizers. When any nitrogen is added to soil, some of the applied nitrogen can be converted to N2O. This can happen to any nitrogen-containing additive including synthetic fertilizers (e.g. nitrate and ammonium) and organic materials (e.g. green manures and pomace). All N2O production associated with vineyards results from soil microbes using the nitrogen instead of the vines. Moreover, some added nitrogen can leach into groundwater and subsequently be converted to N2O. Minimizing N2O emissions may be challenging. For instance, in winegrapes where little fertilizer generally is used, it may be difficult to further decrease emissions of N2O. Use of organic fertilizers and cover crops instead of synthetic fertilizers to supply necessary nitrogen may limit emissions but has not been proven. Timing nitrogen applications to ensure maximum uptake by roots may decrease N2O emissions and nitrogen leaching but more research is needed.
Comparative GHG Impact from Vineyard Nitrogen Management Practices:
Synthetic Fertilizers (CAN, UAN, ammonium nitrate, other nitrate fertilizers, etc.)
- GHG released during manufacture (also applies to pesticides)
- Small percentage directly lost as N2O on site (currently thought to be about 1%)
- Small percentage indirectly lost offsite through leaching/volatilization to NH3 followed by conversion to N2O (currently thought to be roughly 0.3%)
- Potentially higher rate of leaching than organic fertilizers
Organic Fertilizers and Additives (green manure, compost, winery wastes, etc.)
- Small percentage lost directly as N2O on site
- Small percentage indirectly lost offsite through leaching/volatilization to NH3 followed by possible conversion to N2O
- Potentially lower leaching rate than synthetic fertilizers
- Higher rate of volatilization than synthetic fertilizers, in some cases
- More GHG produced by fuel use during tractor operations to apply manures than by fuel use during fertigation
- Effective way to sustainably reduce synthetic fertilizer inputs and recycle winery waste
- Good way to build soil organic matter and thus increase carbon sequestration
- GHG cost of compost and manure transport
Legume Cover Crops
- Small, but unknown percentage probably lost directly as N2O
- Can decrease between-row leaching rate and better retain nitrogen in soil
- Good way to build soil organic matter and thus increase carbon sequestration
- Not the most efficient way to provide vines with nitrogen
Irrigation
Vineyard water use can impact GHG emissions and carbon sequestration. The energy used during irrigation to pump water results in GHG emissions. Moreover, a correlation exists between increased irrigation and GHG emissions from soil. At higher moisture, soils have minimal oxygen content and microbes produce more N2O. Anaerobic soils are optimal environments for microbial production of N2O (and CH4 though less important for vineyards). Wet soils, especially when warm, can also increase CO2 emissions through increased microbial activity and decomposition of organic matter. In contrast, increasing irrigation can offset some GHG emissions by stimulating vines to grow and store carbon in permanent structures. This is a form of above-ground carbon sequestration that is especially effective if vines live for a long time and much of the removed vine biomass is incorporated into the soil to increase organic matter. Various irrigation systems and patterns may differently impact GHG emissions from soils. Drip irrigation is thought to produce less N2O than flood or furrow irrigation at the vineyard level but more research is needed.
GHG Impact from Irrigation Strategy:
- Frequent, low-volume irrigation may produce less N2O than infrequent, highvolume irrigation
- Drip irrigation likely causes lower N2O emissions than flood or furrow irrigation at the vineyard level, but if N fertilizers are applied through the drip line, then this could offset this benefit somewhat by concentrating N in soil, which may increase N2O production under the drip emitter (this is an area of uncertainty)
Tillage
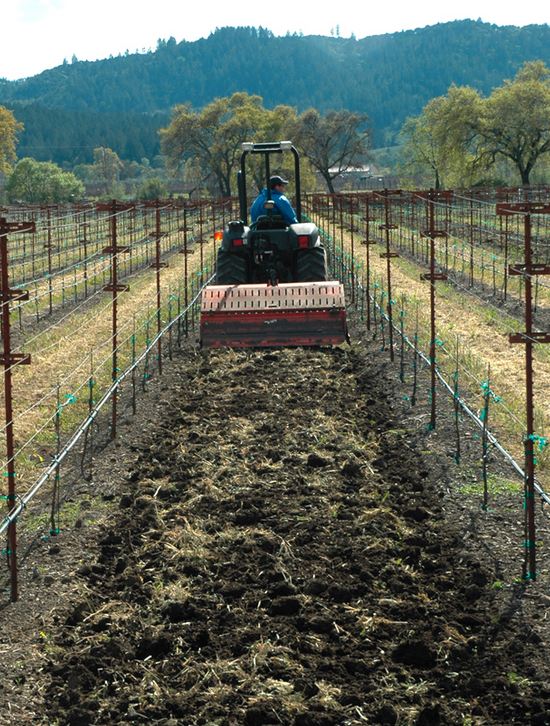
Photo: BioCycle
The act of tilling soil consumes substantial quantities of fossil fuel. Estimates of fuel usage during tillage operations and potential savings from alternative management strategies can be determined using a general calculator at: http://ecat.sc.egov.usda.gov/. (Use the estimated acreage of a wheat cover crop.) The Wine Industry GHG calculator (http://www.wineinstitute.org/ghgprotocol) also performs this function. By breaking up soil aggregates, tillage increases soil emissions of CO2 and possibly N2O by mobilizing carbon and nitrogen, thus allowing microbes to access and consume previously protected organic matter. Each tillage pass causes some loss of soil-sequestered carbon as CO2. Decreases in tillage not only limit CO2 emissions but minimize losses of organic matter through erosion. While building up soil organic matter may lead to some additional CO2 and N2O production, the net balance will be greater soil carbon storage in the long term. Additional research is needed to clarify these impacts in California.
Comparative GHG Impact from Between-Row Tillage Systems:
Conventional Tillage (<30% of crop residues left on surface after tillage):
- Frequent tillage (>1-2 times/year) releases more CO2 by exposing newly formed organic matter to microbial decomposition
- Potentially increased loss of organic matter to erosion
- Decreased capacity of soil to store carbon
- Generally less carbon entering soil organic matter compared with other tillage systems
- Possibly greater consumption of fossil fuels for tractor operations, resulting in more GHG emissions
Conservation/Reduced Tillage (>30% of crop residues left on surface)
- Fewer tillage passes (1 pass/year or even less under certain conditions) releases less CO2 due to slowed organic matter decomposition
- Decreased loss of organic matter to erosion
- Increased ability of soil to store carbon
- Generally more carbon enters soil organic matter than with conventional tillage
- Often associated with cover cropping which also enhances soil carbon storage
- Possibly less GHG emissions associated with tractor operations
No-Tillage (no disturbance of soil surface)
- No GHG emission from tractor tillage operations
- Increased ability of soil to store carbon
- Soil aggregates are not broken up, protecting organic matter from microbial consumption
- Greatest rate of carbon entering soil organic matter from row vegetation
- Cover crops often used, including leguminous plants that supply nitrogen and can lower synthetic nitrogen fertilizer needs
- Depending on site specific factors, increased soil carbon can sometimes lead to higher emissions of the more potent N2O, which may counteract much of the benefit from carbon sequestration

Photo: Tablas Creek Vineyard
Cover Crop Management
The use of cover crops can increase the storage of carbon in vineyard soils and decrease CO2 emissions. Perennial cover crops are most efficient at doing this because of their greater root production. In addition to increasing soil carbon, leguminous cover crops supply nitrogen to the soil, and may be used to decrease applications of synthetic fertilizers. Cover crops also decrease the offsite movement and loss of soil organic matter by erosion and nitrogen by leaching. The relationship between cover crops and GHG production and carbon storage is an area of ongoing research.
GHG Impacts of Cover Crops:
- Increased soil carbon storage (especially perennial cover crops)
- Increased soil nitrogen levels (legumes) and may decrease need for synthetic fertilizers
- Potential reduction in leaching of nitrogen through the soil
- Potential decrease in indirect losses of N2O due to decreased leaching rates
- May require tractor mowing passes which are an additional source of fossil fuel GHG emissions
- May compete with vines for water, possibly resulting in more irrigation and GHG emissions from pumping water
- Potentially decreases losses of soil organic matter to erosion, particularly on hillsides
Vineyard Pruning and Thinning
Vineyard pruning and thinning practices may increase soil carbon storage if the extracted biomass remains in the vineyard. Similarly, the dropping of fruit can be a valuable carbon input. The removal of dead vines represents a loss of carbon storage unless these vines are chipped and left in the vineyard.
GHG Impacts of Pruning/ Thinning Practices:
- Some vine material extracted during pruning and thinning may be incorporated into soil organic matter, increasing carbon sequestration
- Fossil fuel used during mechanical canopy management can contribute substantial amounts of CO2
- Removal of dead vines is a loss of carbon storage unless chipped and left in the vineyard
Hedgerows and Native Vegetation
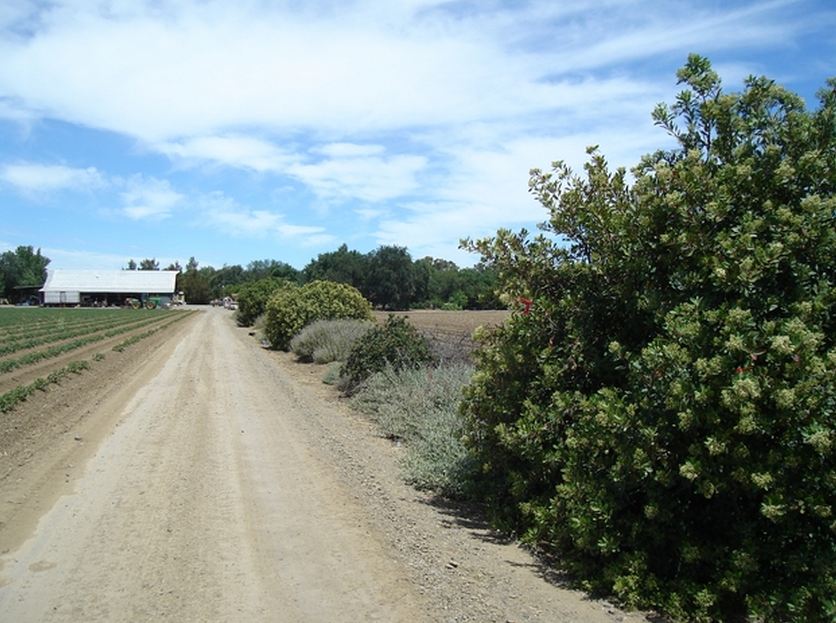
Photo: UC ANR
Planting hedgerows and conserving or restoring natural vegetation may substantially reduce the vineyard GHG footprint. The carbon stored in these woody long-lived perennial plants can represent a large source of sequestered carbon, significantly decreasing overall GHG emissions. Oak woodlands, for example, can store huge amounts of above- and below-ground carbon over their lifetime. Moreover, hedgerows and native vegetation within the vineyard landscape decrease the collective environmental impact of viticultural activities by decreasing soil erosion and the leaching of fertilizers into surface and ground water.
GHG Impacts of Hedgerows and Native Vegetation:
- Native perennial vegetation is a significant source of carbon storage
- Native oak systems store large amounts of carbon in soil and trees
- Decreased potential for erosion and runoff
- Decreased potential for nitrogen and/or pesticide contamination of surface and ground water
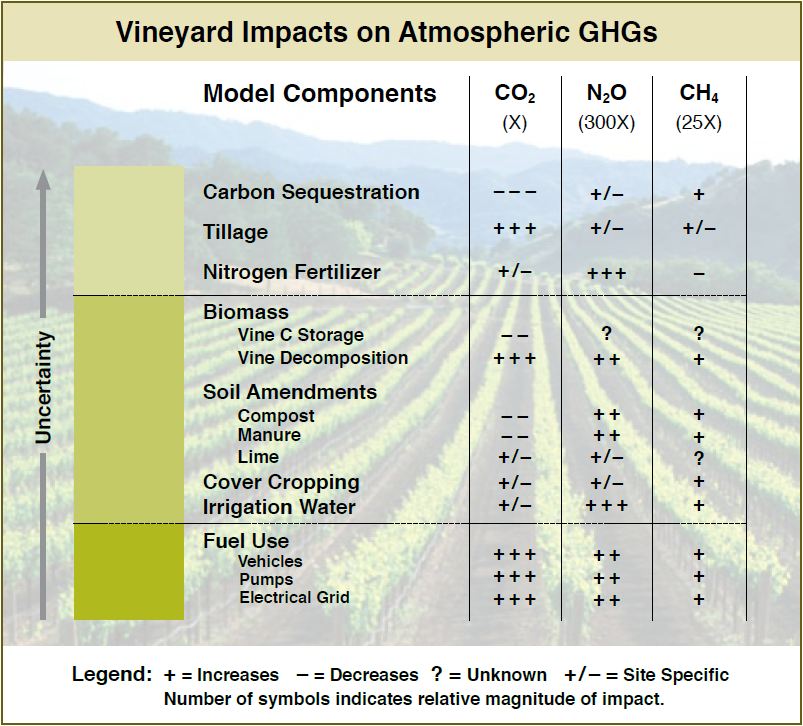
Summary
The diagram above models the relative impact of vineyard practices on the atmospheric GHGs – CO2, N2O, and CH4 – according to scientific understanding. While more research is needed to address knowledge gaps and better understand how practices definitively impact the carbon footprint, this diagram can help practitioners identify and consider practices to continually enhance reductions in their vineyard carbon footprints.
