 All California vineyards become infected at some point by trunk diseases: Botryosphaeria dieback, Esca, Eutypa dieback, and Phomopsis dieback. The symptoms do not become obvious until years 6-8. Trunk diseases limit the productive life of infected vineyards, and can do so only a few years after the breakeven point.
The preventative practices of delayed pruning, double pruning, and applications of thiophanate methyl (TopsinM) have been shown to reduce infections. However, our survey in Lodi in 2013 revealed that few growers are using these practices in young vineyards (see Coffee Shop article). The economic analysis we feature here shows that early adoption of these practices reduces the economic losses from trunk diseases by as much as 96%. These economic gains do not materialize until many years after the practice is adopted, when a vineyard realizes many more years of profitable returns over an infected vineyard in which no action is taken. We hope this article is a convincing argument in favor of preventing trunk diseases starting when the vineyard is young.
__________________________________________________________________________________
 The economic analysis we feature here shows that early adoption of preventative practices reduces the economic losses from trunk diseases by as much as 96%.
It appears that adopting practices that prevent disease establishment in early years of a vineyard’s lifespan gives growers the best chance of offsetting the negative effects of trunk diseases over a 25-year lifespan.
__________________________________________________________________________________
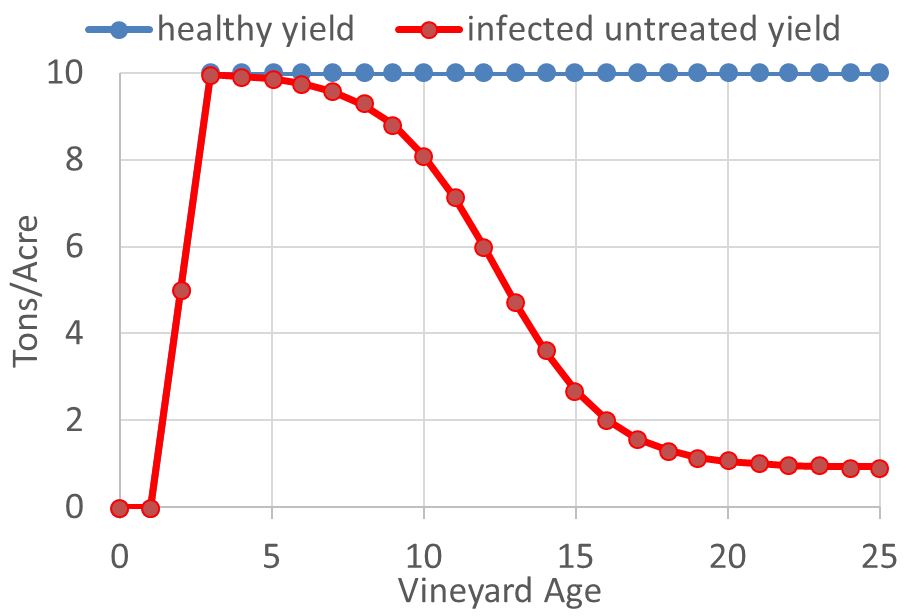
Figure 1: Annual Yields (Tons/Acre) for healthy versus Infected-Untreated Vineyards (based on Munkvold et al. 1994 and Verdegaal et al. 2012).
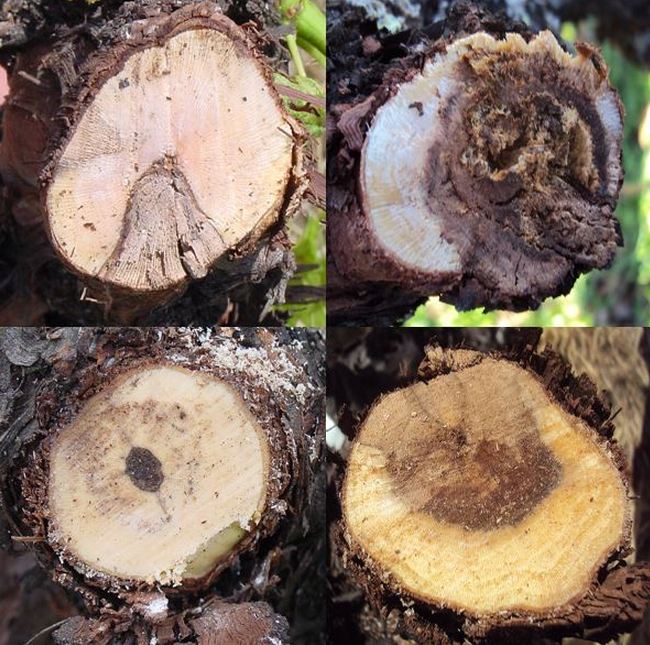
Trunk diseases cause chronic infections of the wood, and a vine accumulates wood cankers over time as new pruning wounds are infected each winter by different trunk pathogens (e.g., Eutypa lata, Neofusicoccum parvum, Togninia minima). The only means of eradicating an infection is by cutting out cankered wood and retraining a new trunk or cordon, a practice known as ‘vine surgery’. This practice is risky, as healthy-looking wood beyond the canker can still harbor an infection, potentially spreading to the new cordon/trunk. Furthermore, even if the newly-trained vine comes back strong, it can’t make up for the multiple years of declining yields leading up to the point of the vine surgery. A more effective strategy is to prevent pruning wounds from infection in the first place (see previous Coffee Shop article on managing trunk diseases).
Figure 1 shows the yield estimates for healthy versus an infected vineyards (untreated = no preventative action is taken). The baseline of our economic model simulates production in a healthy Cabernet Sauvignon vineyard in Lodi over the course of 25 years. Then we ‘mathematically subject’ this vineyard to trunk diseases. By year 10, the infected vineyard has yields that are approx. 20% less than that of the healthy vineyard. By year 15, these losses near 70%. Because trunk diseases have their greatest impacts on yields when the vineyard is mature, the potential gains from preventing pruning-wound infections come later in a vineyard’s lifespan. This doesn’t make it easier to convince growers to adopt these practices in young vineyards.
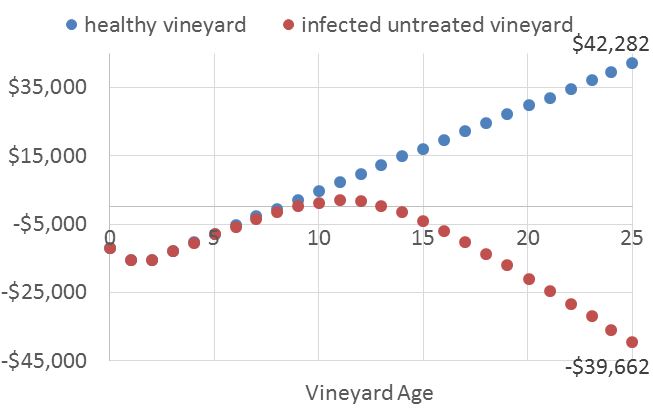
Figure 2: Cumulative Net Returns (Total Revenue – Total Cost) per acre for healthy versus infected-untreated vineyards.
Figure 2 shows the economic effect of trunk diseases by illustrating the cumulative net returns for these two vineyards over the 25- year lifespan. This model is based on The effect of trunk diseases left untreated appears staggering. Annual net returns actually become negative in year 11 as cumulative net returns turn downward, suggesting a very short profitable lifespan. This model is based on the yield simulation presented previously (Figure 1) and economic data on the annual acre costs by vineyard age (2012 UCCE Cabernet Sauvignon cost study) and the 4-year average weighted of $690 per ton for Cabernet Sauvignon (USDA NASS Grape Crush Reports).
Table 1 shows data gathered from the published literature on how effective delayed pruning, double pruning, and hand application of thiophanate methyl (TopsinM) have been in protecting pruning wounds. The ranges in efficacy reflect different results from different studies or different years of the same study. For example, delayed pruning (i.e. pruning in March) was shown by Larignon & Dubos (2000) in Bordeaux, France to protect only 28% of pruning wounds from some of the Esca pathogens, the spores of which were trapped late one dormant season, thus limiting the efficacy of delayed pruning that study year. These same authors found that the same practice protected 87% of pruning wounds in a different study year. We use 25%, 50%, and 75% in our analysis because this captures the range of results scientists have shown in the field for the three practices.
__________________________________________________________________________________
Table 1: Disease Control Efficacies (% pruning wounds protected) for hand-painting pruning wounds with TopsinM, delayed pruning, and double pruning.
______________________________________________________________
| Trunk Disease Botryosphaeria Esca Eutypa |
Hand-painting Topsin 60–80% 52–58 % 100% |
Delayed Pruning 58–72% 28–87% 75–97% |
Double Pruning 58–72%* 28–87%* 75–97% |
______________________________________________________________
*We assume double pruning has same levels of efficacy as delayed pruning because they have the same mechanism of control.
Sources: Amponsah et al. (2012), Larignon & Dubos (2000), Rolshausen et al. (2010), Urbez-Torres & Gubler (2011), Weber et al. (2007).
__________________________________________________________________________________
 In Table 2, we see the cumulative net returns from simulating nine scenarios when preventative practices are adopted at different vineyard ages (year 3, year 5, and year 10). Practices are considered under the varying levels of disease control efficacy (25%, 50%, and 75%). The practice costs shown at the top of Table 2 were compiled with information from UCCE Cost and Return Studies and grower interviews. We use comparisons of the cumulative net returns and years of positive annual net returns between the baseline, healthy vineyard and the infected-untreated vineyard (Figure 1) and these scenarios to gauge the potential economic gains from adopting these practices, relative to taking no action. What this means is that the values below for the different years account for increasing disease incidence (and decreasing yields) over time. In this way, there is very little disease in years 3 and 5, relative to year 10.
__________________________________________________________________________________
Table 2: Cumulative Net Returns ($/Acre) for each practice scenario over a 25-year lifespan. An efficacy level can be interpreted as the percentage of pruning wounds protected by the practice.
______________________________________________________________
Cost ($/Acre) Year 2 Practice Scenario 25% efficacy 50% efficacy 75% efficacy Year 3 Practice Scenario 25% efficacy 50% efficacy 75% efficacy Year 10 Practice Scenario 25% efficacy 50% efficacy 75% efficacy |
Hand-painting Topsin $88.5 – -$20,202 $12,784 $36,930 – -$24,115 $5,787 $33,067 – -$33,521 -$19,624 $4,409 |
Delayed Pruning $0 – -$18,166 $16,767 $38,965 – -$22,256 $7,645 $34,926 – -$32,105 -$18,208 $5,825 |
Double Pruning $273 – -$24,445 $4,482 $32,686 – -$27,989 $1,912 $29,193 – -$36,473 -$22,576 $1,457 |
__________________________________________________________________________________
 We see from these results that adoption of preventative practices results in greater overall economic returns over a 25-year vineyard lifespan compared to doing nothing to combat trunk diseases. All the cumulative net returns are greater than the cumulative net returns for the infected-untreated vineyard (-$39,662). However, only when a practice has a 75% disease control efficacy can a grower wait until year 10 to adopt and still expect positive overall returns. When the disease control efficacy is only 50%, a grower must adopt in year 5 or earlier to expect a similar outcome. Adoption of a practice that is only 25% effective does better than doing nothing, but still results in economic losses over 25 years, suggesting a grower will shorten the vineyard’s lifespan. Fortunately, we might expect a disease control efficacy of around 75% as Cabernet Sauvignon is reported to be very susceptible to Eutypa (Verdegaal et al. 2012, page 5). Regardless, the economic gains in terms of net returns from adopting in year 3 or 5 are in many cases double that of waiting until the vineyard has matured (i.e., waiting until year 10). Clearly, given the cost and revenue structure depicted in these scenarios, the best chance growers have is to adopt as early as possible.
Table 3 provides a different perspective – annual net returns are viewed in terms of the productive lifespan of the vineyard. Scenarios with positive overall net returns are shown in bold. All practice scenarios result in more years of positive annual net returns than doing nothing, but many are not able to experience as productive a lifespan as a healthy vineyard. Only when a practice has a 75% disease control efficacy and is adopted in year 3 or 5 will the vineyard see 25 years of positive annual net returns.
__________________________________________________________________________________
Table 3: Estimated vineyard age when mature vineyard last produces positive annual net returns for each practice scenario.
______________________________________________________________
Year 2 Practice Scenario 25% efficacy 50% efficacy 75% efficacy Year 3 Practice Scenario 25% efficacy 50% efficacy 75% efficacy Year 10 Practice Scenario 25% efficacy 50% efficacy 75% efficacy |
Hand-painting Topsin – 14 20 25 – 14 19 25 – 12 14 19 |
Delayed Pruning – 14 21 25 – 14 19 25 – 12 14 19 |
Double Pruning – 14 19 25 – 13 18 25 – 12 13 18 |
__________________________________________________________________________________
Conclusion
It appears that adopting practices that prevent disease establishment in early years of a vineyard’s lifespan gives growers the best chance of offsetting the negative effects of trunk diseases over a 25-year lifespan. In the future, greater effort is likely needed to inform growers of the benefits of early adoption when they decide how to manage their vineyards. Before we can do that at the crush district level, we will need more information on practice costs and production of other varietals. Currently we have limited information on preventative practices in District 11 and none on the production of important varieties other than Cabernet Sauvignon. According to the 2014 Grape Crush Report, Cabernet Sauvignon represented over 20% of the tonnage, whereas Chardonnay and Zinfandel come in as close seconds at around 19% each. Merlot was a distant fourth at over 11%.
References
- Baumgartner K., Travadon R., Cooper M., Hillis V., Kaplan J., and M. Lubell. 2014. An economic case for early adoption of practices to prevent and manage grapevine trunk diseases. Research Briefs.
- Baumgartner K., Travadon R., Hillis V., Kaplan J., and M. Lubell. 2013. Trends in usage and grower perceptions of preventative practices for management of grapevine trunk diseases. Research Briefs.
- Amponsah, N.T., Jones, E., Ridgwaya, H.J. and M.V. Jaspersa. 2012. “Evaluation of fungicides for the management of Botryosphaeria dieback diseases of grapevines.” Pest Management Science 68: 676–683.
- Larignon, P., and B. Dubos. 2000. “Preliminary studies on the biology of Phaeoacremonium” Phytopathologia Mediterranea. 39: 184-189.
- Munkvold, G.P, Duthie, J.A. and J.J. Marios. 1994. “Reductions in Yield and Vegatative growth of grapevines Due to Eutypa Dieback.” Phytopathology 84(2): 186-192.
- Rolshausen, P.E., Úrbez-Torres, J.R., Rooney-Latham, S., Eskalen, A., Smith, R.J. and W.D. Gubler. 2010. “Evaluation of Pruning Wound Susceptibility and Protection Against Fungi Associated with Grapevine Trunk Diseases.” American Journal of Enology and Viticulture 61:113-119.
- Úrbez-Torres, J.R. and W.D. Gubler. 2011. “Susceptibility of grapevine pruning wounds to infection by Lasiodiplodia theobromae and Neofusicoccum parvum.” Plant Pathology 60: 261–270.
- Weber, E.A., Trouillas, F.P. and W.D. Gubler. 2007. “Double Pruning of Grapevines: A Cultural Practice to Reduce Infections by Eutypa lata.” American Journal of Enology and Viticulture. 58: 61-66.
- Verdegaal, P.S., Klonsky, K.M., and R.L. De Moura. 2012. “Sample Costs to Establish a Vineyard and Produce Winegrapes.” University of California Cooperative Extension, Cost and Return Study. Retrieved March 4, 2015 from.
