 The 2012 Census of Agriculture was released in early May 2014. Average farm size continues to grow in terms of acreage and market value of production. However, this trend is not universal across crop category or geographic region. For the crop category of Land Used for Vegetables, the average acreage allocation per farm reporting production in this category decreased, while certain counties in California experienced an increase in the average acre allocation.
Conducting an agriculture census has been a longstanding activity of the federal government. The 2012 Census of Agriculture was the twenty-eighth U.S. agriculture census. The first agriculture census was in 1840 and a new one has been conducted every five years since 1920. The aim of the census is to provide detailed information on U.S. farms and ranches and their operators to the public, businesses, the government, and analysts. The census summarizes information at the national, state, and county levels. Some information is not reported publicly in order to maintain confidentiality regarding individual operations.
__________________________________________________________________________________
This article was originally published by Emma Knoesen and Rachael Goodhue in ARE Update, Vol.17, No. 5, May/June, 2014. The issue can be accessed by clicking HERE. The ARE Update is a bimonthly magazine published by the University of California Giannini Foundation of Agricultural Economics for the purpose of providing wide dissemination of research results and expert opinion from faculty and graduate students in agricultural and resource economics at UC Davis and UC Berkeley.
__________________________________________________________________________________
The Census of Agriculture enables the comparison of California agriculture to U.S. agriculture. The 2012 census indicates that differences between the two, regarding farm size by acreage and market value of agricultural products, were consistent with the differences reported in 2007 and earlier recent censuses. We focus here on comparing these characteristics in 2012.
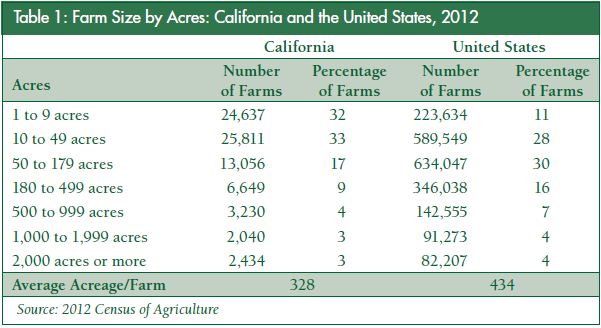 California had smaller farms on average by acreage, with an average farm size of 328 acres, while the United States had an average of 434 acres. Overall, California had a larger percentage of small farms, while the U.S. had more large farms. As seen in Table 1, which documents the size of farms by acreage in California and the United States, a majority (65%) of California farms in 2012 were under 50 acres. Only 39% of farms in the United States were under 50 acres. At the other end of the spectrum, 15% of United States farms were over 500 acres, compared to 10% in California.
While California farms tended to be smaller in terms of acreage, California has more high-value crops, which generate more revenue per acre. These high-value crops mean that California farms tend to have a higher market value of agricultural products sold. The average market value of production per acre of farmland in California was $1,667, compared to $289 in the United States as a whole in 2012.
 Table 2 reports the size of farms in 2012 by their market value of production before taxes or production costs. California had a larger percentage of farms with a large market value of production. Over a quarter, of California farms had a market value of production over $100,000, in comparison to 19% nationally. On average, farms inCalifornia had a market value of production a little under three times the national average: $547,510 for California and $187,097 for the United States.
Evolution of California Agriculture
The census also allows for the evaluation of the development of California agriculture over time because it is conducted every five years. Here, we compare the market value of agricultural products sold and the acreage of farms in 2007 and in 2012. Census data show that over this time period, the average market value of production of California farms increased by 31%. This increase was due to both a reduction in the total number of farms in California and an increase in the number of farms with a large market value of production.
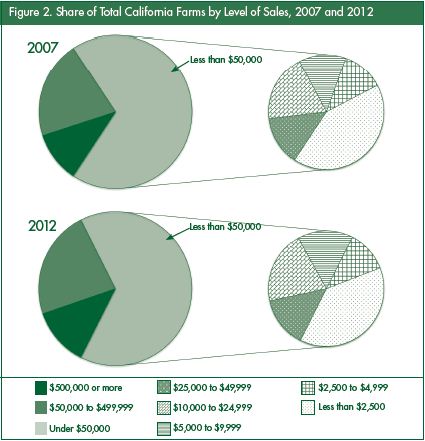
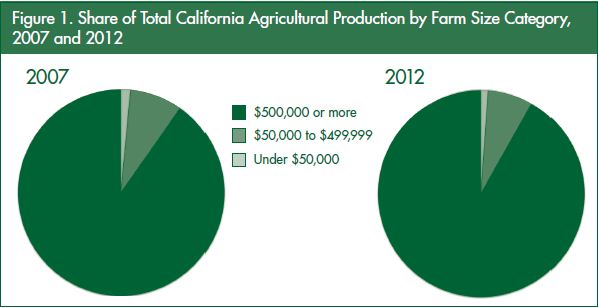 The total number of California farms fell from 81,033 in 2007 to 77,857 in 2012. At the same time, the number of farms in the largest range of market value of production, $500,000 or more, increased from 8,649 to 9,564. These trends were also apparent nationally. Comparing the pie charts in Figure 1, California farms with a large market value of production increased their share of the total market value of production of all California farms. Even though they are only about one-eighth of California farms, those with a market value of production over $500,000 produced a substantial majority of the total market value of production of California farms—92% in 2012, a slight increase from 90% in 2007. California farms’ market value, as well as the percentage of total revenue produced by these higher market value farms, increased. As mentioned earlier, California has a significant number of small farms by acreage and also in market value of production. The majority of farms in both years had a market value of production under $50,000—57% in 2012 and 59% in 2007 as seen in Figure 2. There is considerable heterogeneity within this category. Of the farms with a market value of production under $50,000, 38% were under $2,500 in 2012, compared to 42% in 2007. In both 2007 and 2012, 14% of the farms with a market value of production under $50,000 had a market value of production between $25,000 and $49,999. While there are many small farms, they do not produce a large part of the total market value of production of all California farms. Within the category of market value of production under $50,000, these farms produced 1.5% of the total market value of all California farms in 2007 and 1.1% in 2012.
Variation Across Crop Category
 The census reports the number of farms and acres by crop category. This information allows analysis of the land allocated to and the number of farms producing a specific crop. Here, we report changes in farms with orchards and farms with vegetable and melon production. The definitions used in the census are important for this analysis. For a given crop category, the number of farms is all farms that reported producing that crop, and the acres are the cumulative acres reported for that category. If a farm harvested two or more crops in different categories from the same land, the acres and the farm itself were counted in each crop category. However, if two or more crops in the category Land Used for Vegetables (LUV), which includes all vegetables and melons, were harvested from the same acreage, then the census only counts the acres once. Land in Orchards (LO) includes all acreage with fruit trees, citrus or other groves, vineyards, and nut trees of nonbearing and bearing age, regardless of whether or not it was harvested.
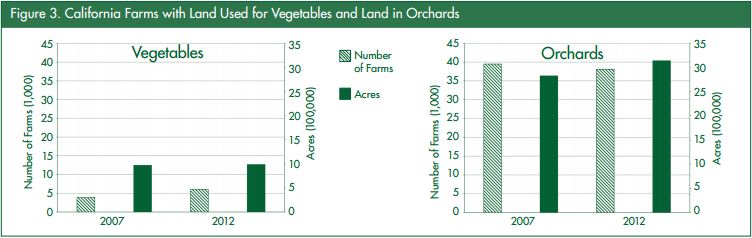
Over the five years between 2007 and 2012, LUV and LO experienced opposite changes in farm size and number. As exhibited in Figure 3, the number of farms with LUV increased by 57%, while acres allocated for vegetables or melons increased only 2%; in 2012, the farms tended to allocate less acres to this category than in 2007. The average acres allocated as LUV per farm decreased from 251 acres in 2007 to 163 acres in 2012. In contrast, the acres allocated as LO per farm grew in size. The number of farms with LO decreased by 4% while acres in LO increased by 10% from 2007 to 2012. This change resulted in an increase in the average acres of LO per farm from 72 acres in 2007 to 82 acres in 2012, or an increase of 13%.
County by County Variation
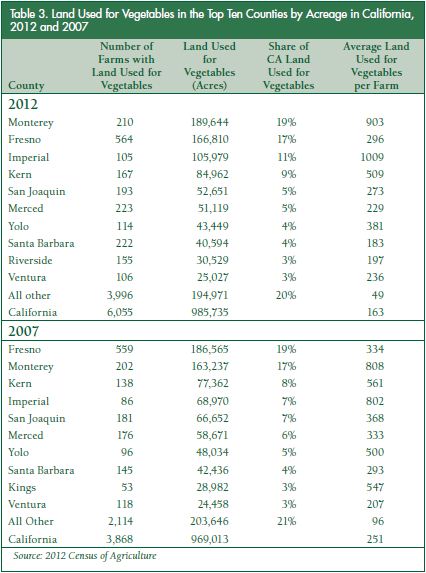
The census provides data on a county level as well. These data enable the comparison of trends on the county, state, and national level. Here, we link the statewide trend of smaller acreage allocation per farm in LUV to developments in major vegetable- producing counties. Of the top ten counties in LUV by acreage, only six experienced a decrease in the average allocation of acres to LUV:Fresno, Kern, San Joaquin, Merced, Yolo, and Santa Barbara.
Table 3 illustrates that four of the top ten vegetable-producing counties in 2012 realized an increase in average vegetable acreage per farm: Monterey, Imperial, Riverside, and Ventura. In Monterey County, the number of farms with LUV increased from 202 in 2007 to 210 in 2012, while the acres allocated as LUV increased from 163,237 acres to 189,644 in that same time. As the county with the largest acreage of LUV in 2012 and the second largest in 2007, Monterey realized a 12% increase in the acre allocation per farm.
A similar trend was seen in Imperial County in which the number of farms with LUV increased from 86 to 105 and the acres allocated increased from 68,970 acres to 105,979 acres from 2007 to 2012. In 2012 Farms with LUV in Imperial County allocated 1,009 acres on average per farm to vegetables or melons, the largest across all California counties. Imperial County had the third most acres in LUV in 2012 and the fourth most in 2007. Imperial County’s average allocation per farm increased 26% from 2007 to 2012.
Conclusion
The Census of Agriculture is an important tool for analysts, the government, businesses, and the public. It enables the analysis of production, agriculture’s evolution over time, and the comparison of agriculture in different geographic regions. The 2012 Census of Agriculture indicates that California agriculture remains distinct from U.S. agriculture as a whole, although in both cases farms continue to grow larger in both acreage and market value of production. California tended to be smaller on average by acres than the rest of the country, yet continued to have farms with higher market value of production from high-value crops. Though the total number of farms in California decreased from 2007 to 2012, the total market value of production of California farms increased by just over one-quarter.
 However, the trend towards larger farms was not universal across all farm types—at least not when measured in acres. LO followed the national as well as state trend with the average acreage allocated by each farm to orchard production growing by 13%. Land Used for Vegetable followed a different trend, with a smaller acre allocation per farm producing vegetables and melons in 2012 than in 2007. The number of acres per farm with LUV decreased just over 35%.
However, this trend was not consistent in every county in California. Some counties, such as Imperial and Monterey, with some of the largest total acreage of LUV, experienced an increase in their average acre allocation per farm. Other counties, such as Fresno, Santa Barbara and Yolo, experienced a decrease in their average acre allocation to LUV per farm, similar to the state trend. The 2012 Census of Agriculture confirms that the agricultural landscape of California is diverse and general trends do not hold for all commodities.
__________________________________________________________________________________
The Giannini Foundation of Agricultural Economics was founded in 1930 from a grant made by the Bancitaly Corporation to the University of California in tribute to its organizer and past president, Amadeo Peter Giannini of San Francisco. Members of the Giannini Foundation are University of California faculty and Cooperative Extension specialists in agricultural and resource economics on the Berkeley, Davis and Riverside campuses. The broad mission of the Foundation is to promote and support research and outreach activities in agricultural economics and rural development relevant to California. For more information and additional resources provided by the Giannini Foundation click HERE.
__________________________________________________________________________________
