 California’s historical climate is prone to deep and long-lasting droughts. Even in normal years, most of the precipitation occurs during the winter in the northern, eastern and coastal parts of the state, whereas most of the water demand occurs in the summer in the southern Central Valley and the largely urbanized areas on the coast. As a consequence, California has one of the most engineered water supply systems in the world that includes dozens of surface-water reservoirs, aqueducts, pumping stations and other infrastructure, with the Sacramento-San Joaquin Delta as the hub.
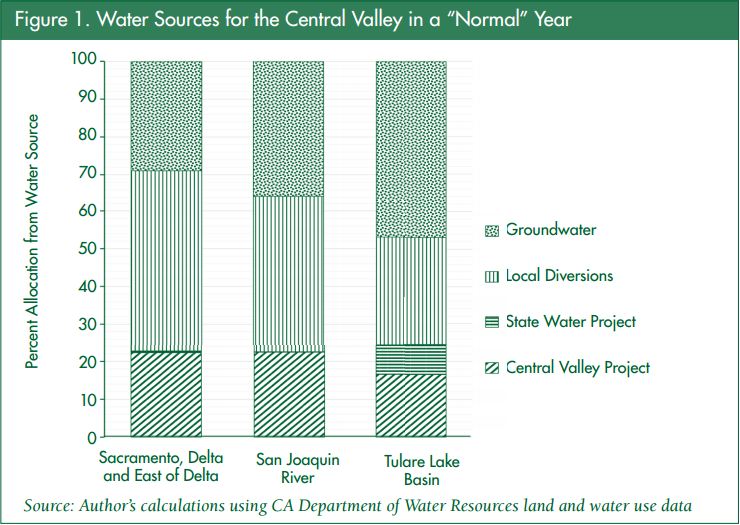
Water sources for agriculture in the Central Valley include the Central Valley Project, the State Water Project, local stream diversions, and groundwater pumping. Figure 1 shows the approximate breakdown of water supply for an average year. Water condition reports from the California Department of Water Resources (DWR) this year indicated slightly higher precipitation in the Sacramento Valley compared to last year (75% versus 56% of the average by June 18), and reservoirs were around 50% of historical average storage by this time of the year. However, the reservoirs in the San Joaquin Valley and Tulare Lake Basin are near all-time lows and precipitation was only 45% of the historical average.
__________________________________________________________________________________
This article introduces a four-part series exploring the economics of California’s drought. The series will be posted here in the Coffee Shop in subsequent weeks.
__________________________________________________________________________________
 The drought impacts are especially severe because California’s population and share of permanent crops have both increased. Furthermore, the lack of water in 2015, together with impacts of additional groundwater pumping that occurred in 2014, may lower the water table levels enough to decrease pumping capacity in some areas.
Every year, the state and federal water projects announce deliveries to water districts. Likewise, local water districts across the state inform their member farmers about expected water allocations. Growers, in turn, make planting decisions based on these expected water deliveries.
In the early spring of 2015, ERA Economics conducted a survey of irrigation districts to assess the expected water deliveries for the irrigation season. The total water shortage is expected to be close to 8.8 million acre-feet (maf) statewide. Farmers and irrigation districts are able to partially offset some of the surface water shortage by pumping additional groundwater. Additional groundwater pumping in 2015 is expected to be 6.2 maf, resulting in a net water shortage of 2.6 maf. The map in Figure 2 shows a breakdown of net water shortages by basin.
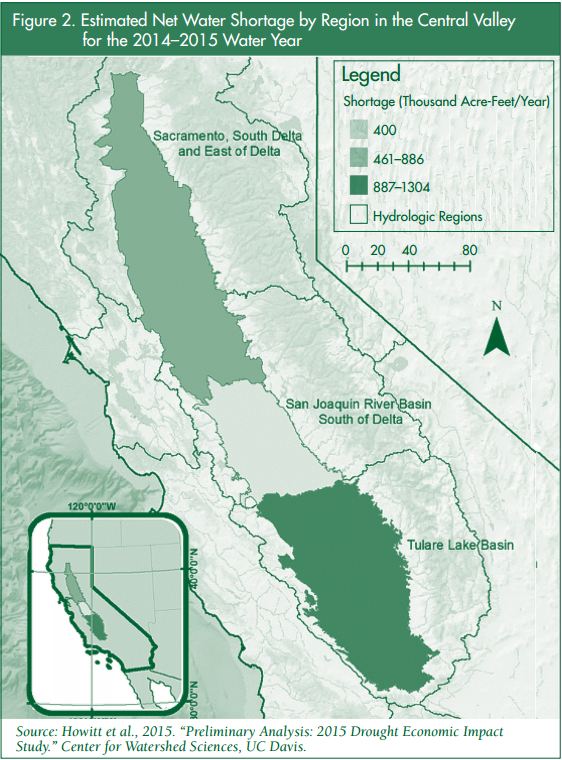
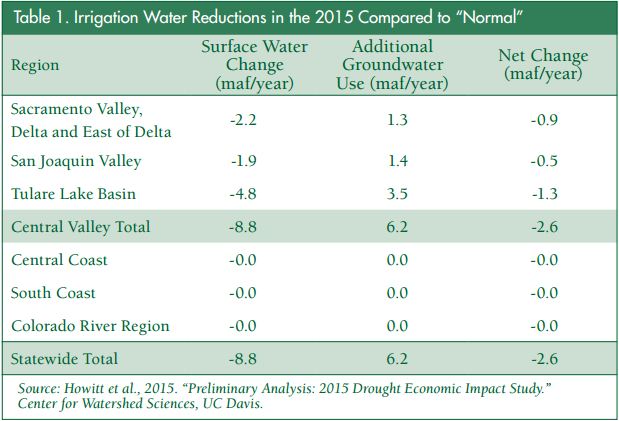
The region most affected by water availability is the Tulare Lake Basin, which includes parts of Fresno, Tulare, Kings, and Kern counties. This area has the lowest precipitation and relies heavily on water imports from other basins and groundwater pumping, yet it provides more than 50% of all agricultural revenues in the Central Valley. The net water reduction of 2.6 maf in 2015 will be 60% higher than 2014 (Table 1).
__________________________________________________________________________________
These articles, written by UC Davis agricultural economists, were originally published in the UC Davis ARE Update, Vol.18, No. 5, May/June, 2015. The issue can be accessed by clicking HERE. The ARE Update is a bimonthly magazine published by the University of California Giannini Foundation of Agricultural Economics for the purpose of providing wide dissemination of research results and expert opinion from faculty and graduate students in agricultural and resource economics at UC Davis and UC Berkeley.
__________________________________________________________________________________
We used the changes in irrigation water supplies and the Statewide Agricultural Production Model (SWAP) to estimate the crop mix and fallowing due to the 2015 drought. The SWAP model is an economic model, which simulates the response of farmers to changes in water supply. The model includes detailed information on crop acreages, values, and regional access to ground and surface water supplies.
 We linked the SWAP model to DWR’s groundwater-surface water simulation model, C2VSim. The C2VSim\ model estimates the groundwater levels and pumping capacities and feeds this information to the SWAP model. Declining groundwater levels increase the energy required to pump groundwater, and in turn the cost of using groundwater for irrigation. The SWAP model simulates the response by farmers to this increased cost of groundwater pumping.
With net shortages of 2.6 maf for 2015, the SWAP model estimates fallowing nearly 564,000 acres statewide—562,000 of which would occur in the Central Valley. Other areas include the Central Coast, the South Coast and inland Southern California, which are less affected by decreased precipitation, have access to groundwater, or import water from other basins such as the Colorado River.
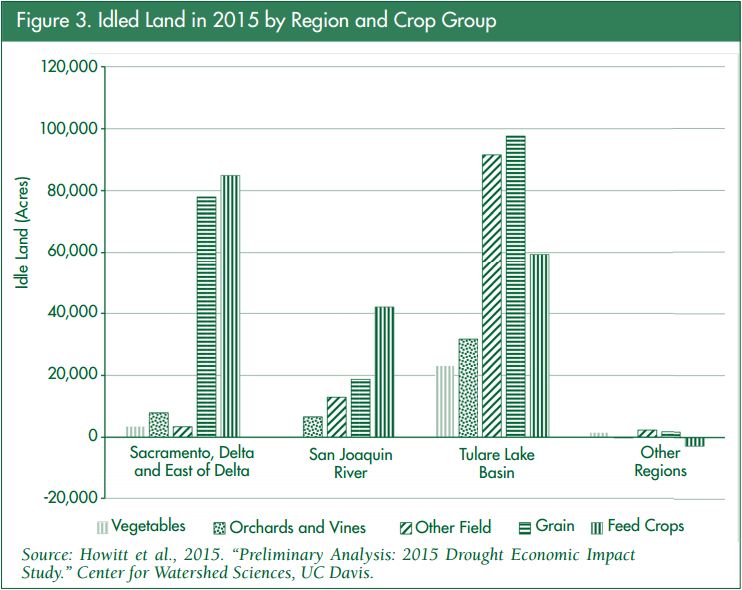
Figure 3 shows a breakdown of estimated fallowing due to the 2015 drought. The bulk of the fallowing occurs in feed and grain crops, in addition to some field crops south of the delta. Fallowing of vegetables, orchards, and vineyards will be minimal, yet the Tulare Lake Basin may fallow some of these higher revenue per acre crops.
We have conducted retrospective analyses of previous droughts and found that the SWAP model accurately estimates fallowing due to water shortages. In addition, we can use multispectral satellite imagery to estimate the total idle land area using measures such as the Normalized Difference Vegetation Index (NDVI). The NDVI estimates total idle land area, whereas SWAP estimates fallow land due to water shortage.
In May 2014, predicted fallowing using SWAP was 410,000 acres in the Central Valley. We compared 2014 and 2011 NDVI measures and found there were an additional 450,000 acres of idle land in 2014 compared to 2011. Similar estimates by NASA Ames found around 500,000 acres of idle land. We note that SWAP estimates are directly based on water changes, whereas satellitebased estimates measure all idle land. Patterns of idle land are consistent between SWAP and the vegetation index methods, and support the overall conclusion that the bulk of the fallowing occurs in the Tulare Lake Basin.
Conclusions
Our preliminary assessment of the economic impacts of the 2015 drought finds about 2.6 maf less net water available for irrigation. Areas in the Central Valley that rely on surface water imports and have limited access to groundwater are likely to fallow significant acreage. We estimate that nearly 55% of this fallowing is occurring in the Tulare Lake Basin.
One-third of the fallowing will be in the Sacramento Valley, the delta, and east of the delta. Statewide, about 87% of the fallowing will be in feed crops such as alfalfa, corn and irrigated pasture, as well as grains and other field crops.
Coastal areas and inland Southern California agriculture are likely to have marginal reductions in irrigated land area. In some cases, there will be a slight increase in the production of some crops due to small changes in commodity prices.
